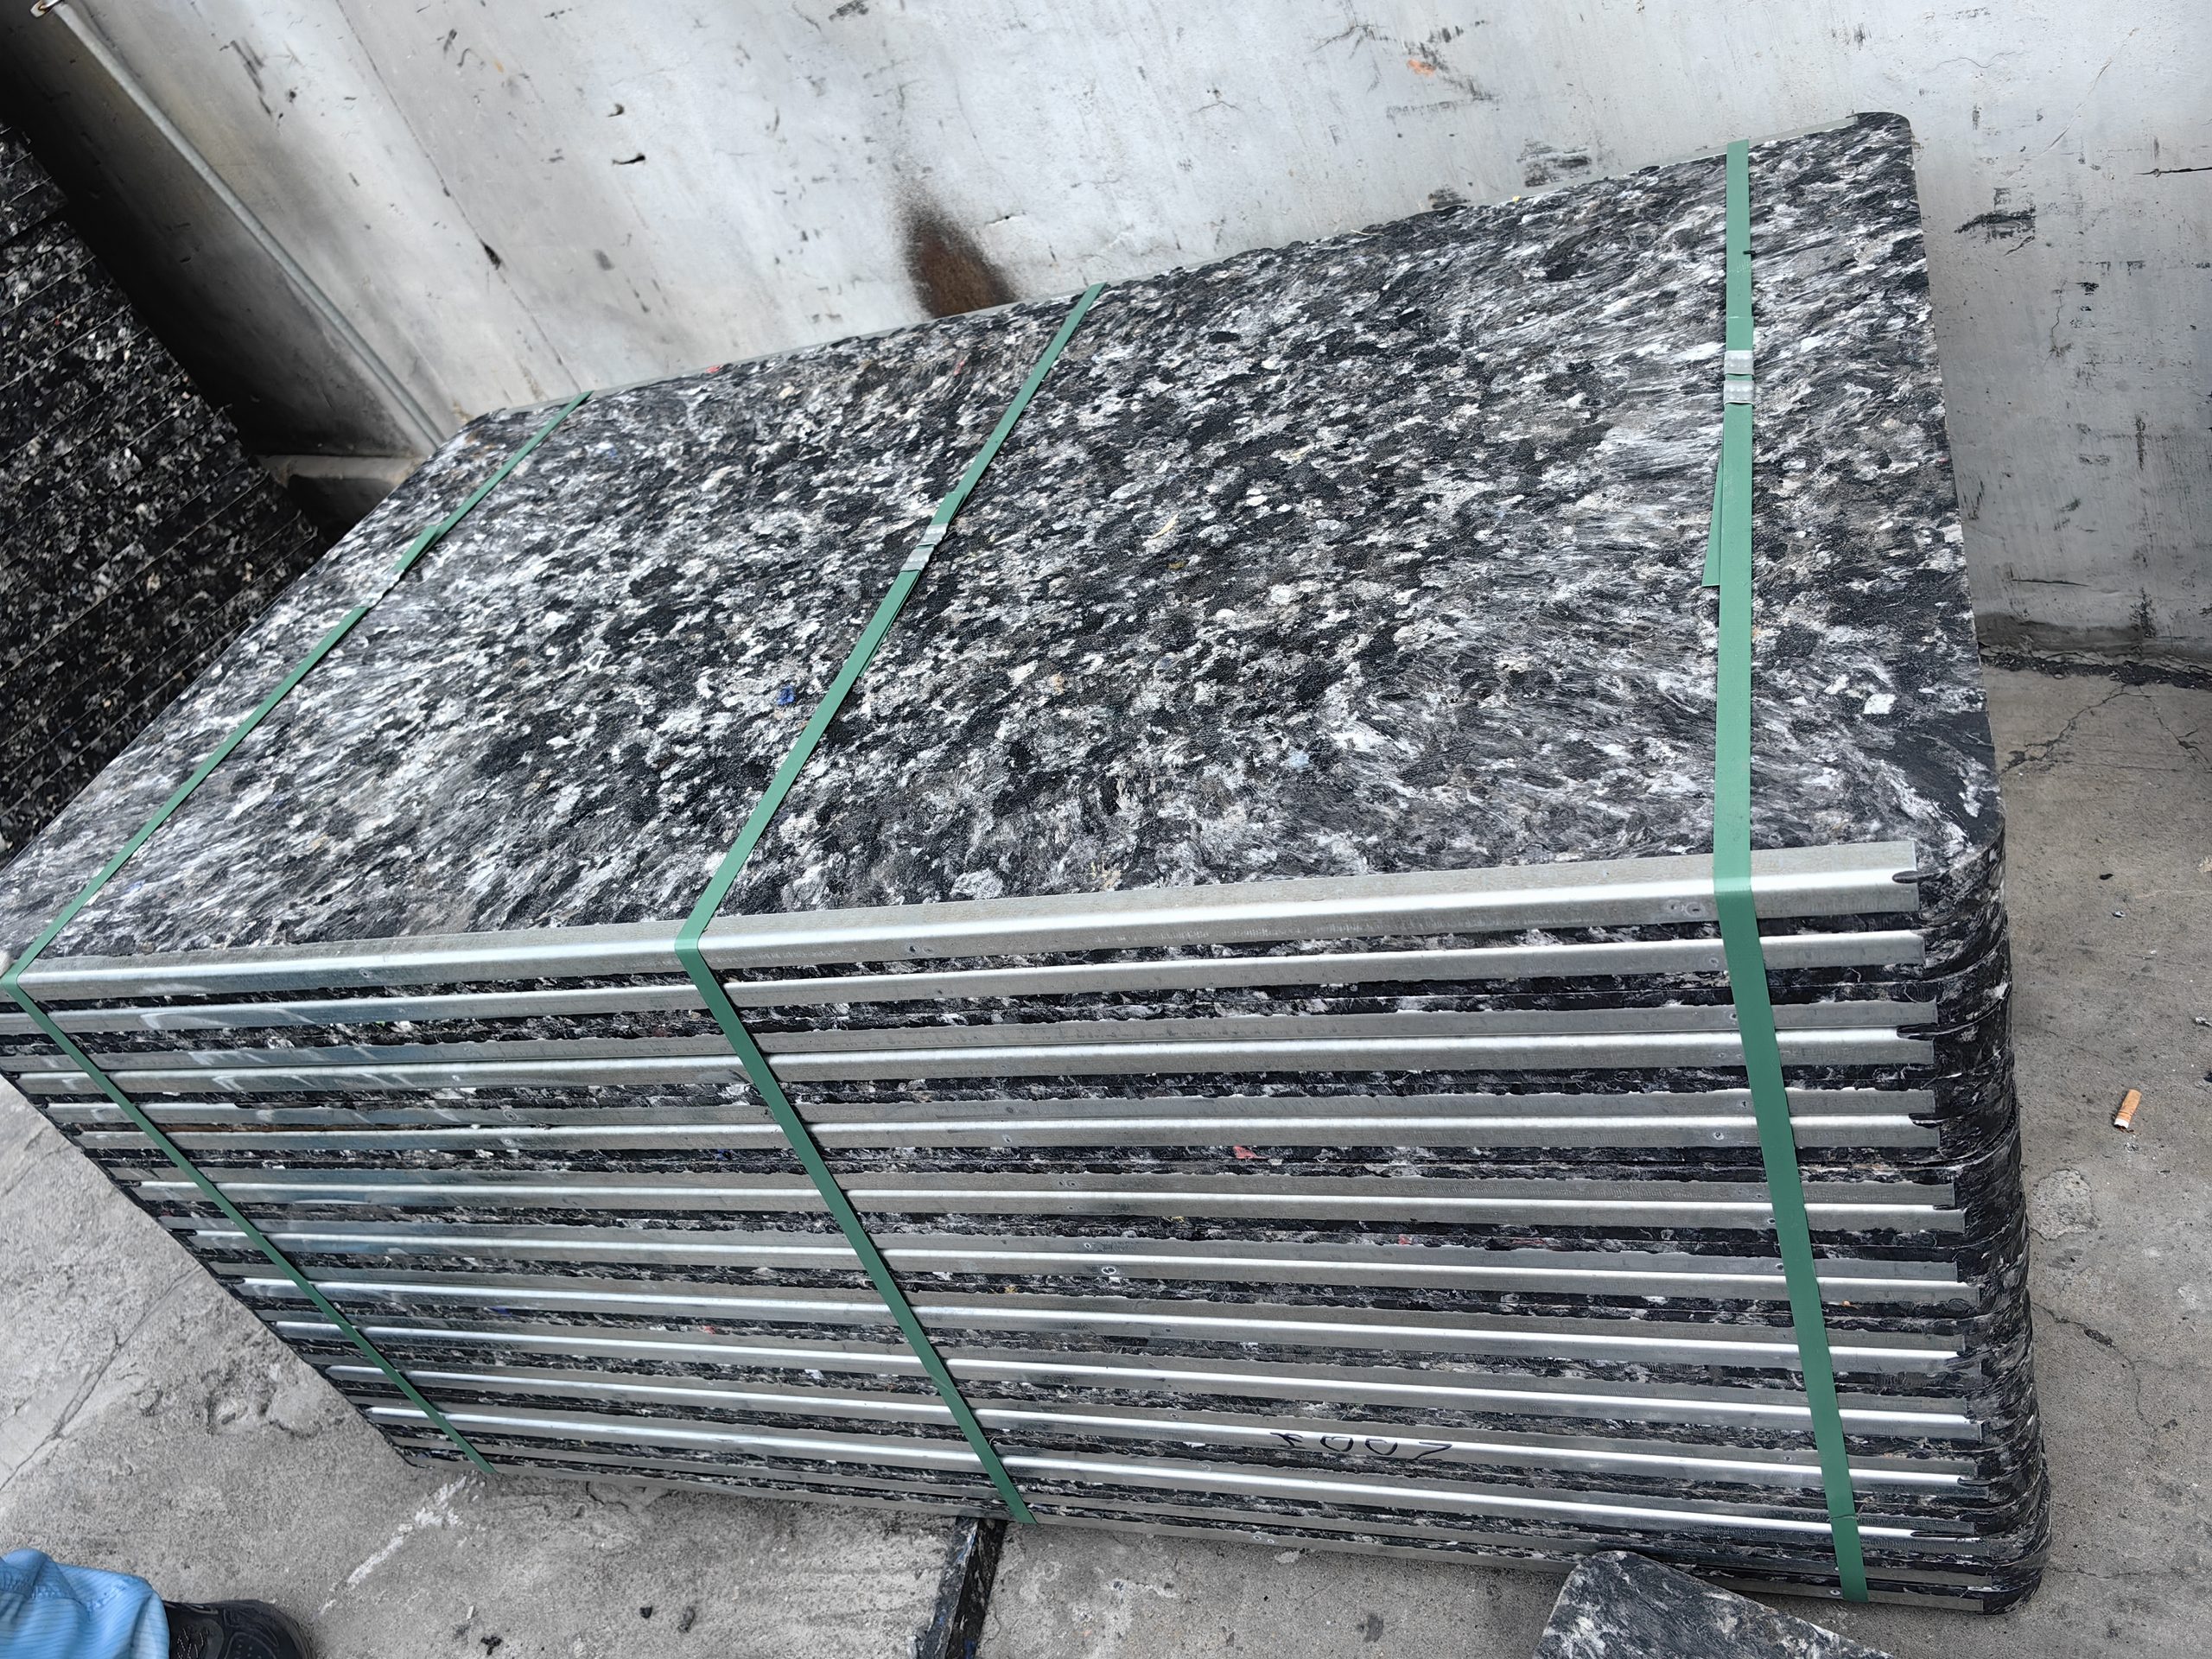
Most brick manufacturers approach pallet budgeting the way they price diesel: cost per unit multiplied by quantity needed. That calculation misses the three decision layers that determine whether your pallet investment delivers returns or becomes a recurring expense: fleet sizing that matches production cycles, quality tiers that align with automation requirements, and replacement scheduling that accounts for lifespan variation across materials. Factory data from operations running 150,000 to 500,000 bricks monthly shows properly planned GMT pallet investments deliver 60-75% lower lifecycle costs than undersized or over-specified fleets.
This guide provides the budget calculation framework production managers use to right-size pallet investments: the four factors that determine fleet requirements, quality tier selection based on production demands, hidden costs that inflate budgets by 20-40%, and financing structures that match cash flow to replacement cycles.
The Four Components of Pallet Fleet Budgeting
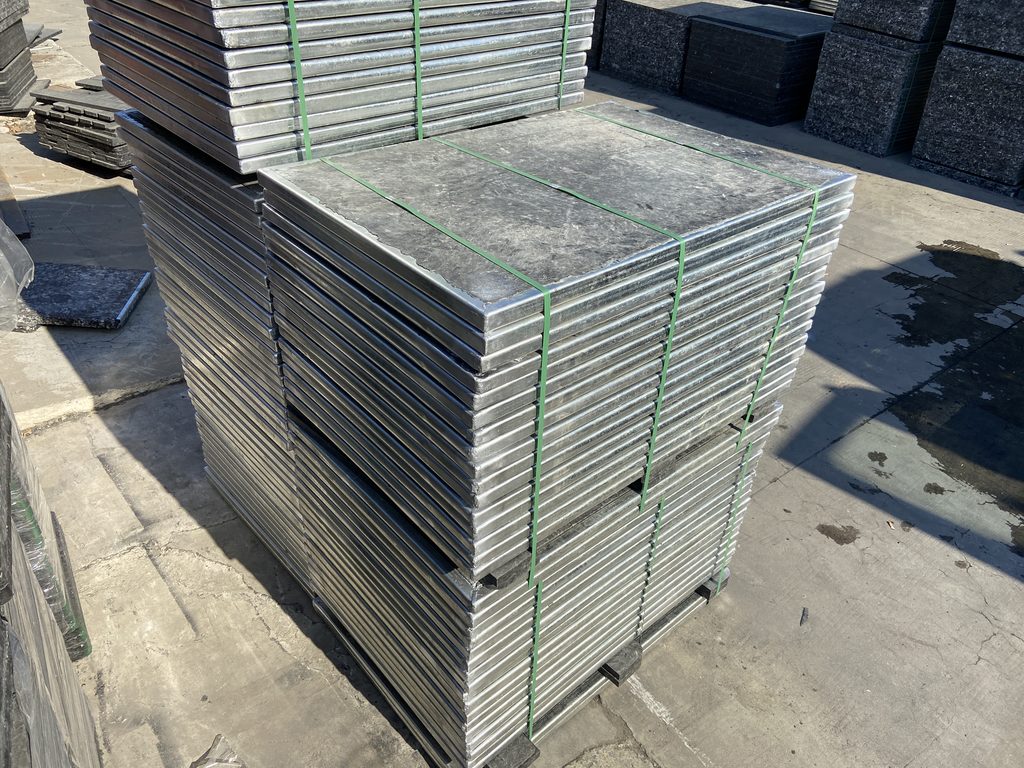
Pallet budget planning extends beyond purchase price to encompass four interconnected cost layers. Base acquisition cost is the unit price multiplied by fleet quantity, typically 40-60% of total first-year expenditure. Delivery and logistics add 8-15% depending on shipping distance and order volume. Installation preparation including handling equipment and storage infrastructure accounts for 5-10%. Replacement reserve budgeting for anticipated annual replenishment completes the framework, representing 8-35% annually depending on material choice.
Wood pallets front 35-40% of total lifecycle cost in the first year but require 30-38% annual replacement, creating recurring budget pressure. GMT pallets front-load 60-70% of lifecycle cost initially but spread remaining 30-40% across 10-12 years through 8-10% replacement rates. The budget planning approach shifts from recurring operational expense management with wood to long-term capital investment optimization with composite materials.
Production volume determines whether budget optimization prioritizes low initial cost or low lifecycle cost. Operations below 100,000 bricks monthly often benefit from wood’s lower upfront capital despite higher replacement frequency. Facilities exceeding 200,000 monthly production see GMT investments recover additional capital within 8-14 months through reduced replacement and breakage costs.
| Budget Component | Percentage of Total | Wood Pallet | GMT Pallet | Notes |
|---|---|---|---|---|
| Base acquisition | 40-60% | $35-45/unit | $95-120/unit | Varies by material grade |
| Delivery logistics | 8-15% | $3-6/unit | $8-15/unit | Distance and volume dependent |
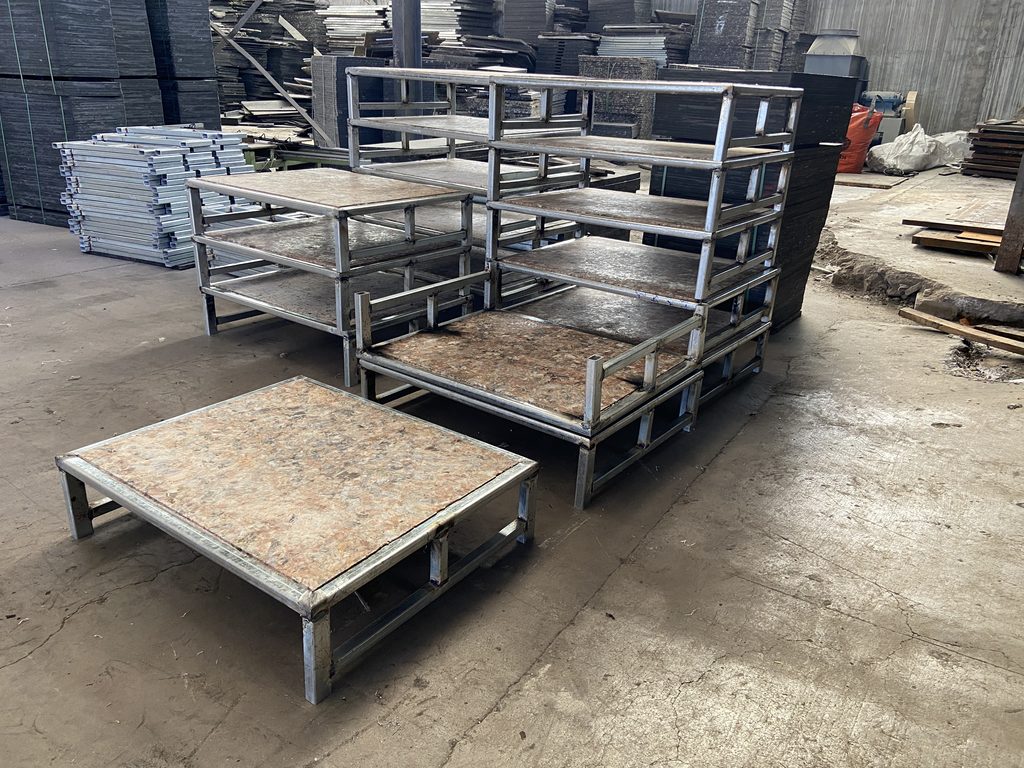
| Installation prep | 5-10% | Minimal | Rack/storage systems | One-time infrastructure |
| Annual replacement | 8-35% | 30-38% fleet | 8-10% fleet | Recurring budget impact |
Calculating Required Fleet Size
Fleet size calculation starts with daily production capacity. A line producing 8,000 bricks per shift requires enough pallets to maintain flow through forming, drying, and curing before return. Cycle time from brick placement to pallet return determines minimum fleet size. Operations with 48-72 hour drying need 6-9 production days’ worth of pallets before first units recirculate.
Base formula:
Minimum fleet size = (Daily production ÷ Bricks per pallet) × Cycle days
A facility producing 8,000 bricks daily with 10 bricks per pallet and 6-day cycle requires (8,000 ÷ 10) × 6 = 4,800 pallets minimum. Add 15-25% buffer for maintenance rotation and expansion planning. Final requirement: 5,520-6,000 pallets.
Automated systems need tighter dimensional tolerance, requiring premium-grade pallets costing 15-25% more. Manual operations tolerate wider variation, permitting economy options reducing cost 20-30%.
Sizing factors:
Brick size variation: Multiple formats need separate pallet sets or universal pallets. Universal systems add 10-15% cost but eliminate multi-format inventory.
Seasonal demand: 40%+ production variation benefits from core fleet sizing to low-season plus rental pallets for peaks.
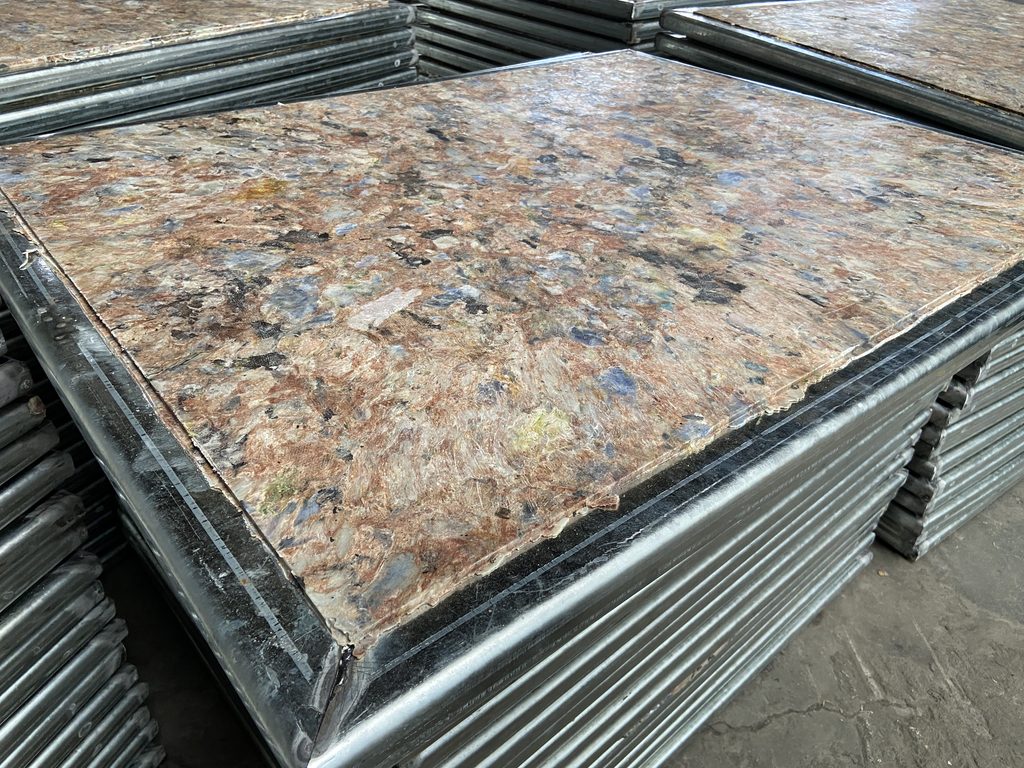
Expansion: Budget 10-20% overcapacity if growth anticipated within 24 months. Adding pallets later costs 8-12% more per unit than bulk purchases.
| Production Scale | Daily Output | Cycle Time | Base Fleet | Buffer | Total Fleet |
|---|---|---|---|---|---|
| Small manual | 3,000-5,000 | 5-7 days | 150-350 | 20-25% | 180-440 |
| Medium semi-auto | 8,000-15,000 | 4-6 days | 320-900 | 15-20% | 370-1,080 |
| Large automated | 20,000-40,000 | 3-5 days | 600-2,000 | 15-20% | 690-2,400 |
| Industrial high-speed | 50,000+ | 2-4 days | 1,000-5,000 | 10-15% | 1,100-5,750 |
Quality Tiers and Cost Implications
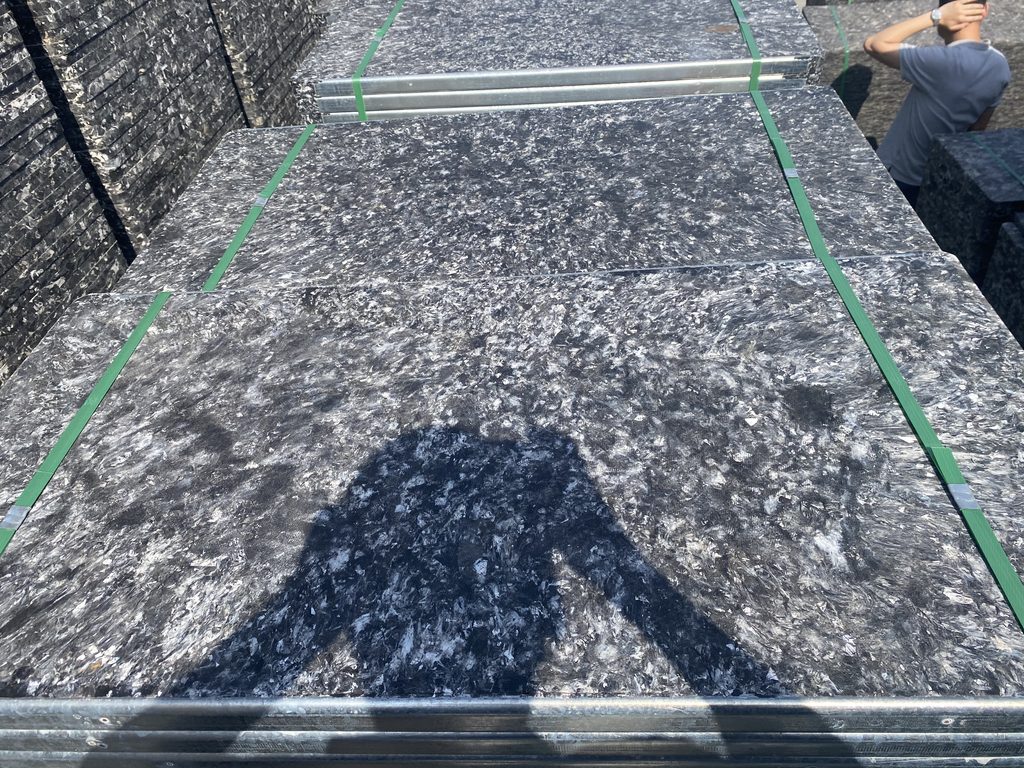
Pallet quality tiers impact acquisition cost and operational performance. Economy wood pallets ($28-38) suit temporary operations but carry 35-45% annual replacement rates. Standard GMT pallets ($85-105) serve general production with 10-12 year lifespan and 8-10% replacement. Premium fiber-reinforced pallets ($110-130) target automated lines requiring tight dimensional tolerance.
Material selection determines maintenance burden. Wood requires 10-18 hours monthly inspection per 200-unit fleet, adding $3,600-6,700 annual labor. Composite pallets need 2-4 hours monthly, reducing maintenance to $750-1,500 annually.
Surface quality affects brick defects. Budget-grade pallets with ±3-5mm flatness cause 8-14% brick breakage. Premium pallets holding ±1-2mm tolerance reduce breakage to 2-4%, saving $85,000-140,000 annually for 250,000 brick/month operations.
Quality tier decision:
Choose economy wood when: Under 50,000 bricks monthly, facility lifespan under 3 years, capital constrained, manual handling.
Choose standard GMT when: 100,000-300,000 bricks monthly, 5-15 year plan, semi-automated systems, moderate humidity.
Choose premium fiber when: Exceeds 300,000 monthly, fully automated handling, dimensional tolerance critical, harsh climate, 15+ year plan.
Initial Investment Calculation
Calculate initial investment by multiplying fleet size by delivered unit cost, then adding infrastructure expenses. A 600-pallet GMT fleet at $105 per unit costs $63,000 base. Storage racks add $4,500-8,000. Handling equipment upgrades contribute $2,000-5,000. Total: $69,500-76,000.
Worked example for 220,000 monthly brick operation:
Production: 10,000 bricks/day, 10 bricks/pallet, 5-day cycle
Base fleet: (10,000 ÷ 10) × 5 = 5,000 pallets
Buffer: 5,000 × 18% = 900 pallets
Total: 5,900 pallets
Economy wood: 5,900 × $38 + 10% delivery + $6,000 infrastructure = $252,620
Standard GMT: 5,900 × $98 + 12% delivery + $12,000 infrastructure = $659,584
The $406,964 difference GMT recovers through reduced replacement (saving $65,000-85,000 annually) and lower breakage (saving $110,000-145,000 annually), delivering 18-24 month payback.
Lifecycle Cost Analysis
Lifecycle costing reveals total expenditure from initial purchase through end-of-service across the pallet fleet’s operational span. Wood fleets appear economical initially but accumulate replacement costs that exceed GMT’s upfront investment within 24-36 months.
10-year lifecycle comparison for 600-pallet fleet:
Wood: Year 0 $24,000 + Replacement $81,600 + Maintenance $45,000 = $150,600
GMT: Year 0 $63,000 + Replacement $56,700 + Maintenance $12,000 = $131,700
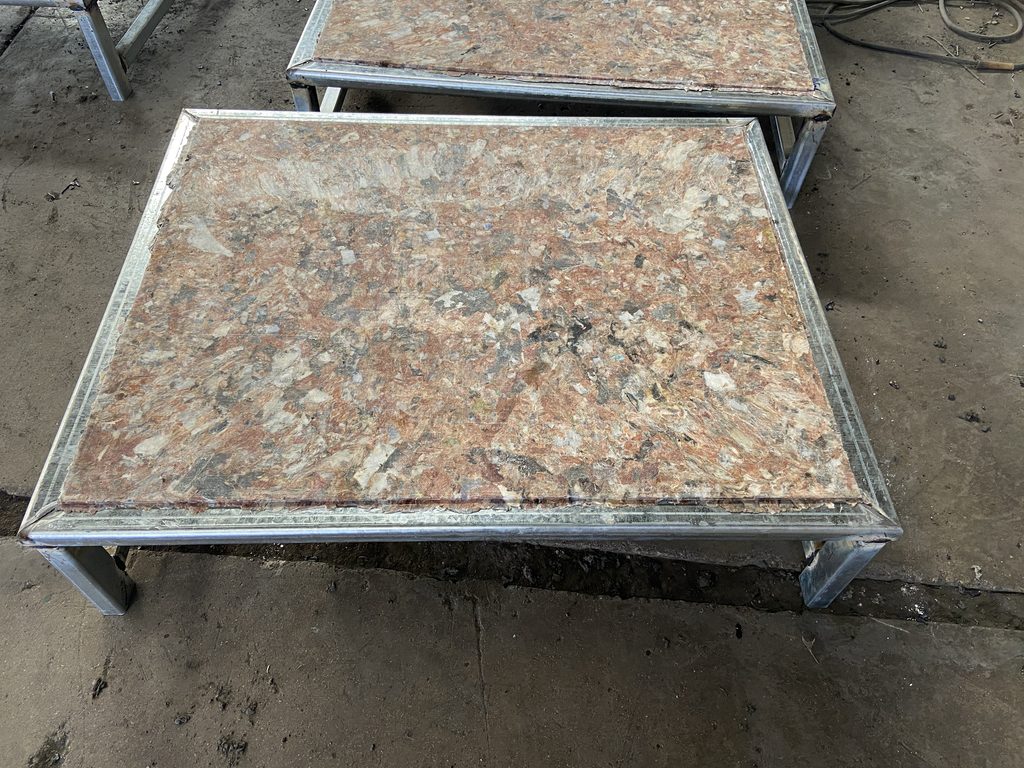
Lifecycle savings: $18,900 (12.5% reduction). This excludes brick breakage differences that add $75,000-120,000 additional GMT savings over 10 years for operations producing 150,000+ bricks monthly, shifting total advantage to 45-65% lifecycle cost reduction.
Wood’s 30-38% replacement rate means a 600-pallet fleet purchases 1,800-2,280 units over 10 years to maintain 600 active. GMT’s 8-10% rate requires 480-600 replacements, reducing transaction volume by 73-79%.
| Material | Initial Cost | 10-Year Replacement | Maintenance | 10-Year Total |
|---|---|---|---|---|
| Economy wood | $24,000 | $81,600 | $45,000 | $150,600 |
| Standard GMT | $63,000 | $56,700 | $12,000 | $131,700 |
| Premium GMT | $72,000 | $64,800 | $10,000 | $146,800 |
Hidden Costs That Inflate Budgets
Pallet budgets frequently underestimate cost categories that surface during implementation. Delivery surcharges for remote locations add 15-35% to quoted FOB prices. Customs duties for international purchases contribute 8-18%. Currency fluctuations introduce 5-12% variance for multi-month deliveries in foreign currencies.
Storage infrastructure escapes initial budgets. Outdoor storage requires weather protection costing $8,000-15,000 for 400-800 pallet capacity. Indoor rack systems cost $12-25 per pallet position, meaning $7,200-15,000 for a 600-pallet fleet.
Handling equipment compatibility assessment identifies forklift modifications or conveyor adjustments. Budget $3,000-8,000 for handling system modifications. Insurance on shipments worth $50,000+ adds 1.5-3% of value.
Frequently omitted cost categories:
Import duties (international): 8-18% of FOB value
Storage infrastructure: $12-25 per pallet capacity
Handling equipment mods: $3,000-8,000 one-time
Insurance on shipment: 1.5-3% of order value
Spare buffer stock: 5-10% additional units
Comprehensive budgeting adds 18-28% to base acquisition cost for small-medium orders and 12-18% for large fleet purchases.
Financing and Payment Structures
Pallet financing structures range from full upfront payment receiving 3-8% early payment discounts to supplier credit terms splitting payment across delivery milestones.
Common payment structures:
Full prepayment: 3-8% discount, 45-60 day lead time, lowest per-unit cost. Suitable for well-capitalized operations.
50/50 split: 50% deposit at order, 50% before shipment, 2-4% discount, standard for medium orders ($30,000-100,000).
Milestone-based: 30% deposit, 40% at production, 30% upon delivery, minimal discount, extends payment across 60-90 days.
Net 30-60 terms: Full payment 30-60 days after delivery, available for established customers, adds 3-6% to unit cost.
Consignment for trial phases allows testing 100-200 GMT pallets before full commitment. Consignment units cost 15-25% more but provide risk mitigation.
| Payment Structure | Total Cost (600 pallets) | Cash Flow Impact |
|---|---|---|
| Full prepayment | $58,590 | High initial, 6% savings |
| 50/50 split | $63,000 | Moderate, standard |
| Milestone | $65,100 | Distributed, +3% |
| Net 60 | $66,780 | Deferred, +6% |
Phased Investment Strategy
Operations facing capital constraints benefit from phased GMT adoption spreading investment across 12-36 months while demonstrating performance incrementally. Phase 1 replaces 20-30% of fleet with GMT in highest-wear positions. Phase 2 expands to 50-60% after validating durability improvements. Phase 3 completes transition as wood units reach replacement age naturally.
36-month phased adoption for 800-pallet fleet:
Phase 1 (Months 0-6): 200 highest-cycle positions, $22,000
Phase 2 (Months 12-18): Add 300 units reaching 50% GMT, $31,500
Phase 3 (Months 24-36): Complete to 700 GMT, 100 wood reserve, $20,000
Total: $73,500 spread across 36 months versus $82,000-88,000 immediate full replacement. Phased approach costs 2-4% more but validates ROI before major capital commitment.
Budget Planning by Production Scale
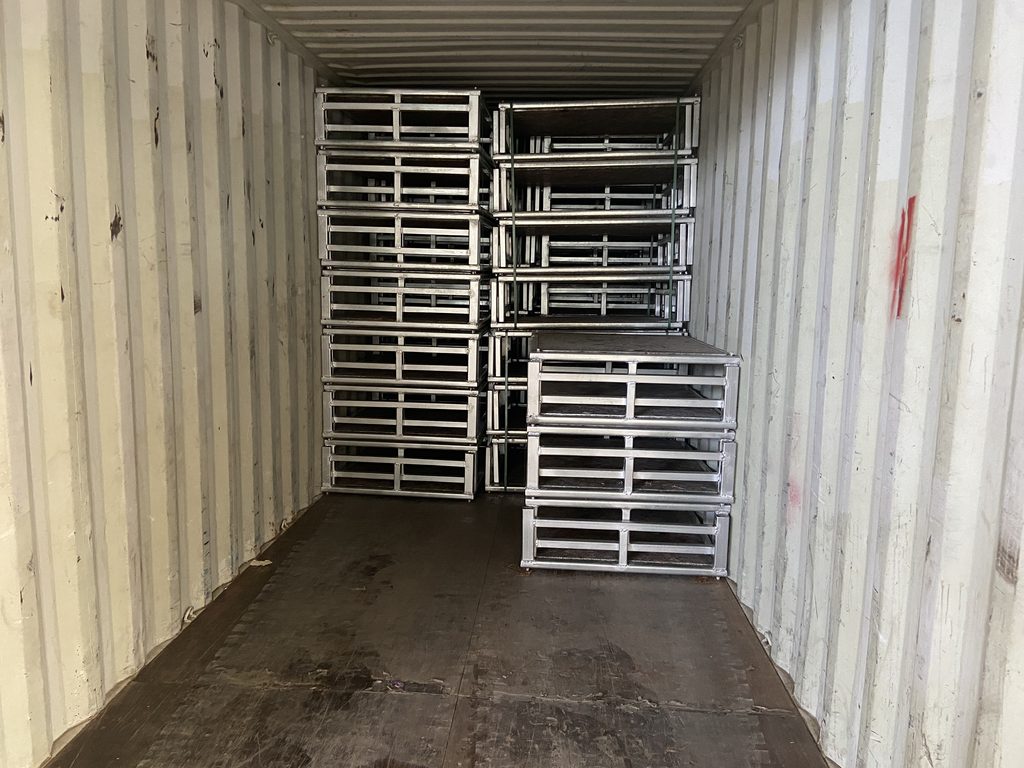
Budget requirements scale non-linearly with production volume. Bulk purchasing and optimized logistics reduce large fleet costs per pallet by 15-25% versus small orders.
Small operation (50,000-120,000 bricks monthly):
Fleet: 150-350 pallets | Wood: $6,000-14,000 initial | GMT: $16,500-38,500 initial
Medium operation (150,000-300,000 bricks monthly):
Fleet: 400-900 pallets | Wood: $16,000-36,000 initial | GMT: $42,000-99,000 initial
Standard GMT delivers 14-20 month payback
Large operation (350,000-600,000 bricks monthly):
Fleet: 1,000-2,000 pallets | Wood: $40,000-80,000 initial | GMT: $105,000-220,000 initial
Premium GMT mandatory for automated lines
Industrial scale (600,000+ bricks monthly):
Fleet: 2,200-5,000+ pallets | Wood: $88,000-200,000 initial | GMT: $231,000-550,000 initial
Full GMT fleet with volume pricing negotiations critical
| Production Scale | Fleet Size | Wood Initial | GMT Initial | Wood Annual Replacement | GMT Annual Replacement |
|---|---|---|---|---|---|
| Small | 150-350 | $6,000-14,000 | $16,500-38,500 | $2,100-5,300 | $1,400-3,500 |
| Medium | 400-900 | $16,000-36,000 | $42,000-99,000 | $5,800-13,700 | $3,800-9,500 |
| Large | 1,000-2,000 | $40,000-80,000 | $105,000-220,000 | $14,400-30,400 | $9,500-22,000 |
| Industrial | 2,200-5,000 | $88,000-200,000 | $231,000-550,000 | $31,700-76,000 | $20,900-55,000 |
Cost Optimization Opportunities
Volume discounts activate at order thresholds varying by supplier. Orders exceeding 500 pallets receive 5-8% reduction. Bulk purchases of 1,000+ units access 10-15% discounts. Coordinate with neighboring facilities to aggregate orders when individual requirements fall short of volume tiers.
Direct manufacturer purchasing eliminates distributor margins adding 15-25%. Factory-direct orders require larger minimums (200-500 units) and longer lead times (60-90 days) but deliver significant per-unit savings.
Multi-year contracts guarantee pricing for scheduled replacements, protecting against 3-7% annual inflation. Mixed-grade strategies deploy premium pallets in high-stress positions (30-40% of fleet) and standard grades elsewhere, reducing average cost 12-18% versus full premium fleets.
FAQ
How do I estimate replacement reserve budget for year 2-5?
Calculate as: fleet size × replacement rate × projected unit cost with 3-5% inflation. For 600 GMT pallets: 600 × 9% × $105 × 1.04 = $5,900 Year 2 budget.
What percentage of production budget should pallets represent?
Typically 2-5% of annual production budget. Initial fleet purchases may spike to 8-12% in Year 1. If pallet costs exceed 6-7%, this indicates oversized fleet or below-market brick pricing.
How do I budget for mixed brick format production?
Calculate separate fleet requirements per format based on volume distribution. Standardize on universal pallet dimensions when possible. Universal designs cost 10-15% premium but reduce inventory complexity.
Should I budget for spare inventory?
Maintain 5-10% spare buffer beyond calculated requirements. Automated operations need 8-10%, manual operations 5-7%. Include in initial capital budget.
How does climate affect budget planning?
Humid climates accelerate wood degradation, increasing replacement from 30-35% to 40-50%. Budget 15-25% higher annual replacement for wood in tropical regions. GMT maintains consistent rates across climates.
What’s the budget impact of mid-cycle switching?
Creates temporary overlap carrying both wood and GMT inventories (6-18 months). Budget: (Wood book value) + (GMT purchase) – (Wood salvage at 15-30%). Phase transition across 24-36 months to minimize overlap costs.
Conclusion
Pallet budget planning determines whether your fleet investment optimizes production cost or becomes recurring financial pressure. Properly calculated budgets account for fleet sizing based on production cycles, quality tier selection matching automation requirements, lifecycle costs beyond initial purchase, and hidden expenses that inflate budgets 18-28%. Facilities producing 150,000+ bricks monthly see GMT pallets deliver 60-75% lower lifecycle costs versus wood through reduced replacement frequency and maintenance requirements.
Rhinos Pallet manufactures fiber-reinforced GMT pallets with 10-12 year service life, <1% moisture absorption, and dimensional precision suitable for automated brick production. Our engineering team provides facility-specific budget calculations, fleet sizing analysis, and phased investment planning. Contact us for detailed budget worksheets and volume pricing for your production scale.