Skip to content
Most brick manufacturers calculate pallet ROI wrong. They compare a $30 wood pallet against a $110 GMT pallet, see a 3-4x gap, and stop. That ignores replacement frequency, maintenance labor, and breakage costs, the factors that decide which pallet actually wins financially. Facility data across plants running 80,000 to 300,000+ units monthly shows a properly calculated GMT pallet return on investment lands between 1 and 14 months, not the “never” a price-only comparison implies.
This guide walks through the ROI worksheet our team uses for pallet conversions: five cost inputs to pull from your line, the formula that turns them into a payback number, a worked example from a 175-pallet facility, and a table showing how volume and climate shift your timeline.
What Pallet ROI Actually Measures
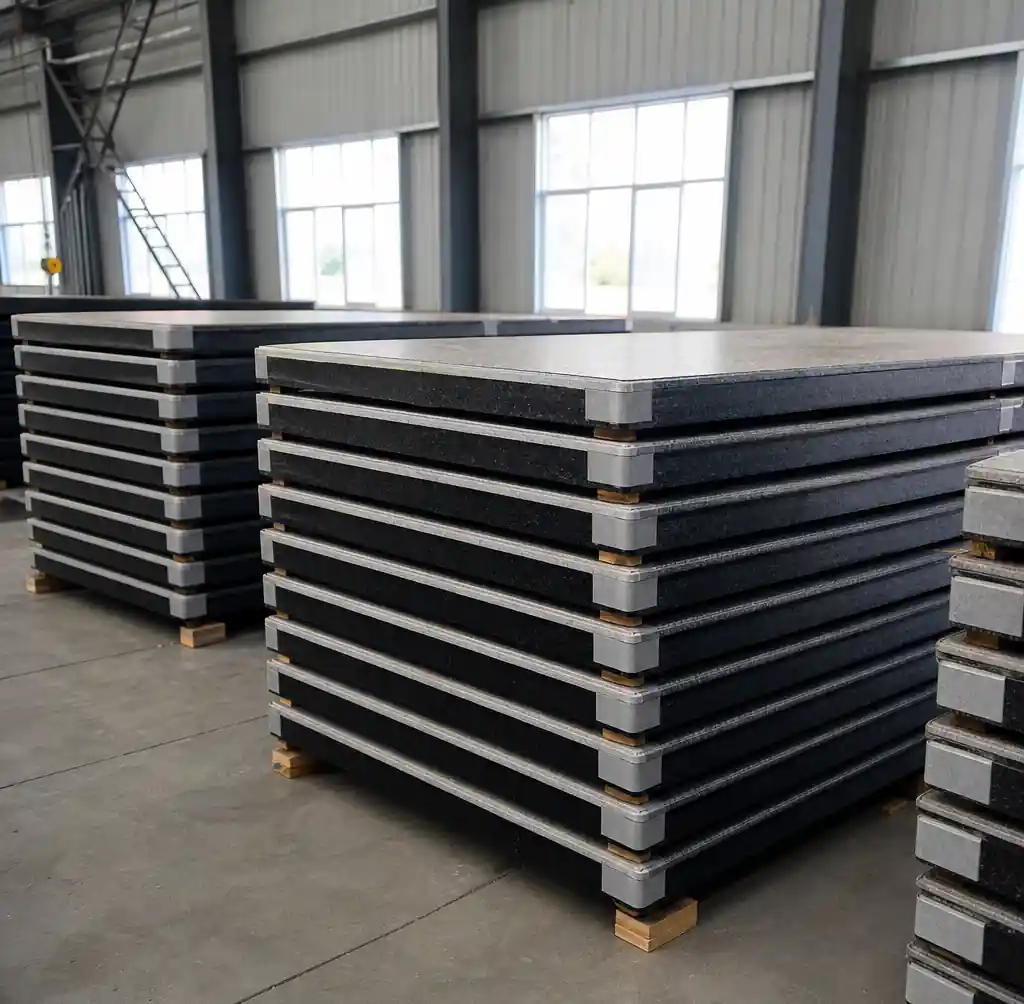
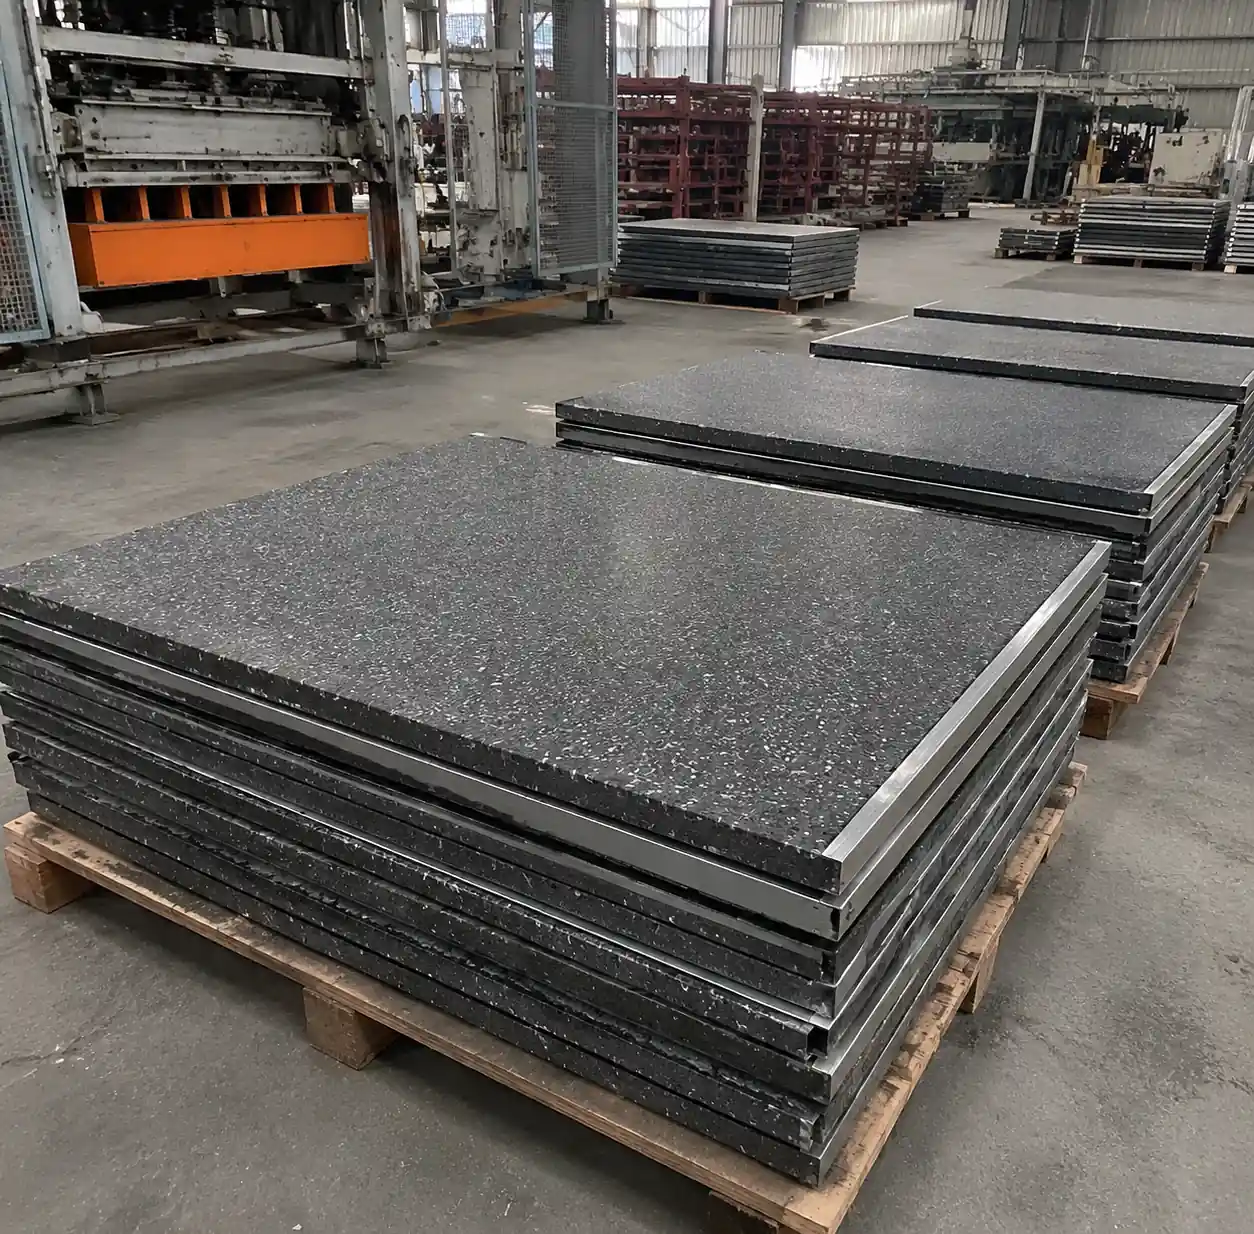
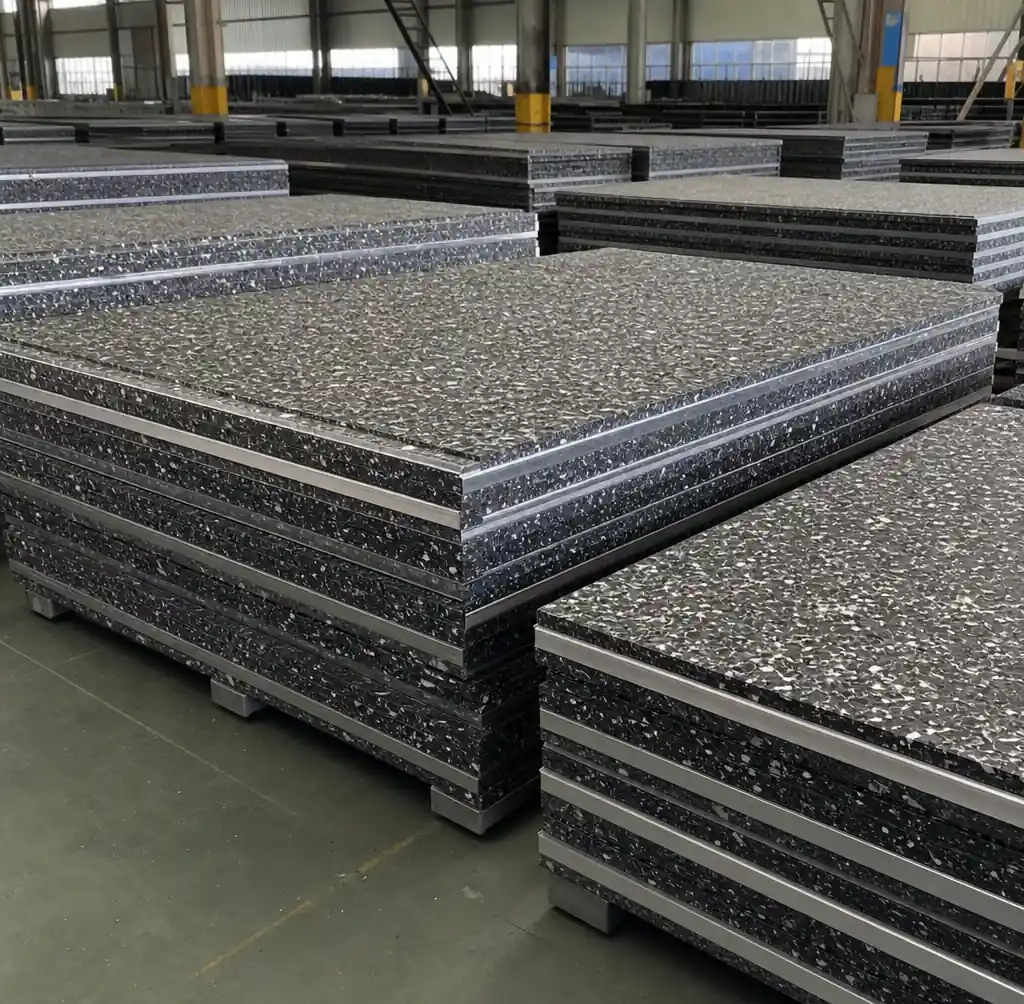
Pallet ROI is not a price comparison. It measures every dollar a pallet generates or consumes across its working life: purchase cost, replacement frequency, maintenance labor, and the brick losses caused by a warped or inconsistent surface. Wood pallets look cheaper on the purchase order because their $25-45 unit price hides a 2-3 year service life. High-quality GMT pallets cost $85-135 per unit but run 10-12 years without replacement, the single variable that flips the math.
This formula treats GMT pallets as a capital asset with a measurable payback period, not a discretionary upgrade — useful when you need to justify the investment to a plant manager with numbers rather than durability claims.

Building Your ROI Worksheet: The Five Cost Inputs
Pull five numbers from your own production records first. Most of this data already exists in maintenance logs and purchase orders — you just haven’t put it side by side yet.
Fleet size is your active pallet count, including curing-cycle buffer inventory. Unit price is the delivered cost per pallet, not list price before volume discounts. Annual replacement rate is the share of your fleet replaced each year, pulled from purchase orders. Maintenance labor is hours spent monthly on inspection, cleaning, and repair per 200-pallet block. Breakage-related loss is the percentage of bricks scrapped from pallet-caused defects or warping.
| Cost Input | What to Measure | Typical Wood Baseline | Typical GMT Baseline |
|---|---|---|---|
| Fleet size | Total pallets in active rotation | Facility-specific | Facility-specific |
| Unit price (delivered) | Quoted price per pallet | $25-45 | $85-135 |
| Annual replacement rate | % of fleet replaced per year | 30-38% | 8-10% |
| Maintenance labor | Hours/month per 200 pallets | 12-20 hrs | 2-3 hrs |
| Breakage-related loss | % of bricks lost to pallet defects | 8-12% | 2-4% |
Once you have your own numbers in the right-hand columns, the worksheet becomes specific to your facility instead of an industry average.
The GMT Pallet ROI Formula
The core formula compares your additional upfront capital against the annual savings that capital generates. It has three parts: the extra investment, the annual benefit, and the resulting payback period.
Step 1 — Additional investment: Fleet size × (GMT unit price − Wood unit price)
Step 2 — Annual benefit: (Wood replacement cost − GMT replacement cost) + (Wood maintenance cost − GMT maintenance cost) + (Wood breakage loss − GMT breakage loss)
Step 3 — Payback period: Additional investment ÷ Annual benefit
This separates three savings drivers instead of one vague “GMT is better” claim. Replacement savings alone rarely justify the switch in low-volume operations. Maintenance and breakage savings usually decide the outcome, especially on automated lines where dimensional consistency affects throughput directly. Use your actual labor rate, not a national average — labor cost alone swings the maintenance line by 30-40% between regions.
Worked Example: 175-Pallet Brick Facility
Here is the formula applied to a mid-size facility running 175 active pallets, producing roughly 220,000 standard bricks monthly on a semi-automated line.
Step 1 — Additional investment
175 pallets × ($105 GMT − $35 wood) = $12,250 additional capital
Step 2 — Annual benefit
Replacement savings: Wood (175 × 34% × $35 = $2,082) minus GMT (175 × 9% × $105 = $1,654) = $428
Maintenance savings: Wood (16 hrs/month × 12 × $26/hr = $4,992) minus GMT (2.5 hrs/month × 12 × $26/hr = $780) = $4,212
Breakage savings: at $0.62 per brick material cost and 220,000 bricks/month, wood’s 10% average loss rate costs $16,368/month versus GMT’s 3% average loss rate at $4,910/month. Annualized: ($196,416 − $58,920) = $137,496
Total annual benefit: $428 + $4,212 + $137,496 = $142,136
Step 3 — Payback period
$12,250 ÷ $142,136 = 0.086 years, or roughly 1 month

This facility recovers its additional GMT investment inside the first production month, almost entirely through breakage reduction. That’s the consistent pattern in field data: at meaningful monthly volume, breakage savings dominate payback, not the pallet price gap. Low-volume or manual operations with smaller breakage exposure see a longer, still favorable, payback — the table below breaks out volume tiers.
| Cost Component | Wood (Annual) | GMT (Annual) | Annual Savings |
|---|---|---|---|
| Replacement purchases | $2,082 | $1,654 | $428 |
| Maintenance labor | $4,992 | $780 | $4,212 |
| Breakage material loss | $196,416 | $58,920 | $137,496 |
| Total annual benefit | — | — | $142,136 |
| Additional investment | — | — | $12,250 |
| Payback period | — | — | ~1 month |
Not every facility runs 220,000 bricks monthly at a 10% wood breakage rate. The table below breaks the timeline out by volume tier and climate so you can locate your own profile.

Payback Period by Production Volume and Climate
Volume and humidity move your payback period the most. Higher throughput multiplies breakage savings across more units. Higher humidity accelerates wood pallet failure, widening the replacement and maintenance gap on top.
Manual, low-volume lines see smaller absolute breakage savings simply because fewer bricks pass over each pallet monthly. Automated, high-volume lines in humid regions see the fastest payback because breakage exposure and wood degradation both run higher at once. Moisture-resistant GMT pallets close both gaps simultaneously.
| Facility Profile | Monthly Volume | Climate | Typical Wood Breakage Rate | Estimated Payback |
|---|---|---|---|---|
| Manual, low-volume | 40,000-80,000 | Dry/temperate | 5-7% | 8-14 months |
| Semi-automated, mid-volume | 100,000-200,000 | Temperate | 7-9% | 2-6 months |
| Semi-automated, mid-volume | 100,000-200,000 | Humid/coastal | 9-12% | 1-3 months |
| Automated, high-volume | 250,000+ | Temperate | 8-10% | 1-2 months |
| Automated, high-volume | 250,000+ | Humid/tropical | 10-14% | Under 1 month |
Use the closest row as a sanity check, then run your own numbers through the formula above. A table is a starting point, not a substitute for facility data.
What Changes Your Payback Timeline
Four variables shift payback more than any others, and none is the pallet price itself.
Production volume. More bricks per pallet per month means more breakage-avoidance dollars flowing through the same fixed capital gap. This is why high-volume automated lines beat the “18-24 month” industry rule of thumb quoted elsewhere.
Climate and humidity. Above 65-70% relative humidity, wood pallet moisture absorption climbs toward 15-20%, accelerating warping and pushing breakage toward the upper end of the range. Fiber-reinforced pallets hold under 1% absorption regardless of ambient humidity, so the savings gap widens rather than narrows in these regions.
Automation level. Automated grippers penalize dimensional inconsistency through error-triggered stops. Wood pallets drift past tolerance within 6-12 months, so automated facilities lose throughput before the pallet fails.
Labor rate. Maintenance savings scale with local wages. A facility paying $18/hour sees roughly 30% smaller maintenance savings than one paying $26/hour with identical inspection hours. Plug your actual rate into Step 2.
Mistakes That Skew Your ROI Calculation
Using list price instead of delivered cost. Volume discounts of 15-25% on orders above 500 units change your Step 1 investment gap substantially. Get a quoted price for your actual order size first.
Ignoring breakage data because it feels imprecise. Breakage is usually the largest line in the benefit calculation, as the worked example shows. Skipping it because your logs are informal understates GMT’s return by an order of magnitude. A rough week-long count beats leaving it out.
Applying a national average replacement rate. Your own purchase order history over 24-36 months beats any published average, since replacement rate depends heavily on climate and handling practices.
Ignoring automation plans. If automation is on your 3-5 year roadmap, factor dimensional consistency into today’s decision, not just current-year savings. Retrofitting a wood-pallet line for automation later adds cost a pure ROI formula won’t capture.
FAQ
What’s a realistic payback period for switching to GMT pallets?
Mid-to-high-volume facilities (100,000+ bricks monthly) typically see 1-6 months once breakage savings are included, not the 18-24 months quoted from replacement-cost-only comparisons. Low-volume manual operations under 80,000 bricks monthly typically see 8-14 months.
Do I need to include breakage savings, or is replacement cost enough?
Include it. In the worked example, breakage reduction was over 96% of the annual benefit, replacement savings under 1%. Skipping breakage data throws your estimate off by roughly an order of magnitude.
How do I estimate breakage rate without formal tracking?
Count rejected bricks against daily output for 5-7 days, noting which show pallet-related defects versus other causes. This rough sample is accurate enough to run the formula, refined later with formal QC data.
Does this apply to concrete block production the same way?
Yes, the same five-input formula applies. Block producers see slightly lower breakage rates but higher per-unit costs, keeping the breakage-savings line comparably large. Adjust the per-unit cost in Step 2 to your block’s figure.
What if my facility runs below 80,000 bricks monthly?
Payback shifts toward 8-14 months rather than under 6, since absolute breakage savings are smaller. Still a positive return, just longer. Consider phased conversion, starting with automated or high-humidity zones where payback is fastest.
Should I use supplier lifespan figures or my own field data?
Use your own field data whenever available. Supplier figures (10-12 years GMT, 2-3 years wood) reflect typical conditions, but your actual replacement rate depends on your handling practices, climate, and production intensity.
Conclusion
A pallet ROI calculation built only on purchase price will always favor wood and will always be wrong. The five-input worksheet in this guide — fleet size, unit price, replacement rate, maintenance labor, and breakage loss — captures where the real money moves. In the worked example, breakage reduction alone delivered over $137,000 in annual savings against a $12,250 capital gap, a payback measured in weeks rather than years.
Your own numbers will differ based on volume, climate, and automation level, which is exactly why the formula exists instead of a fixed industry rule of thumb. Pull your fleet size, delivered unit prices, replacement history, and a rough breakage sample, then run the three-step calculation with your own labor rate. Most facilities producing 100,000+ bricks monthly find payback inside 6 months once breakage savings are counted correctly.
Rhinos Pallet manufactures fiber-reinforced GMT pallets built for the durability and dimensional consistency this ROI model depends on: 10+ year service life, under 1% moisture absorption, and ±2mm dimensional tolerance across the full service life. Contact us today for a delivered quote sized to your fleet count, so you can run this worksheet with real numbers instead of estimates.