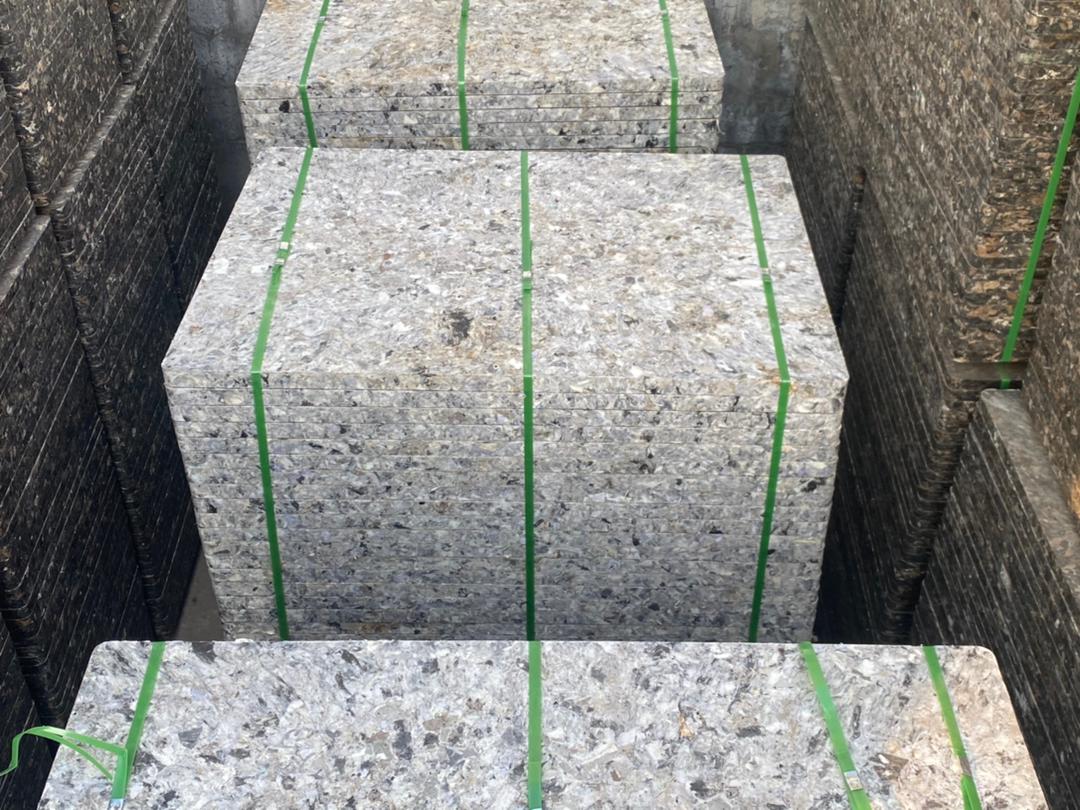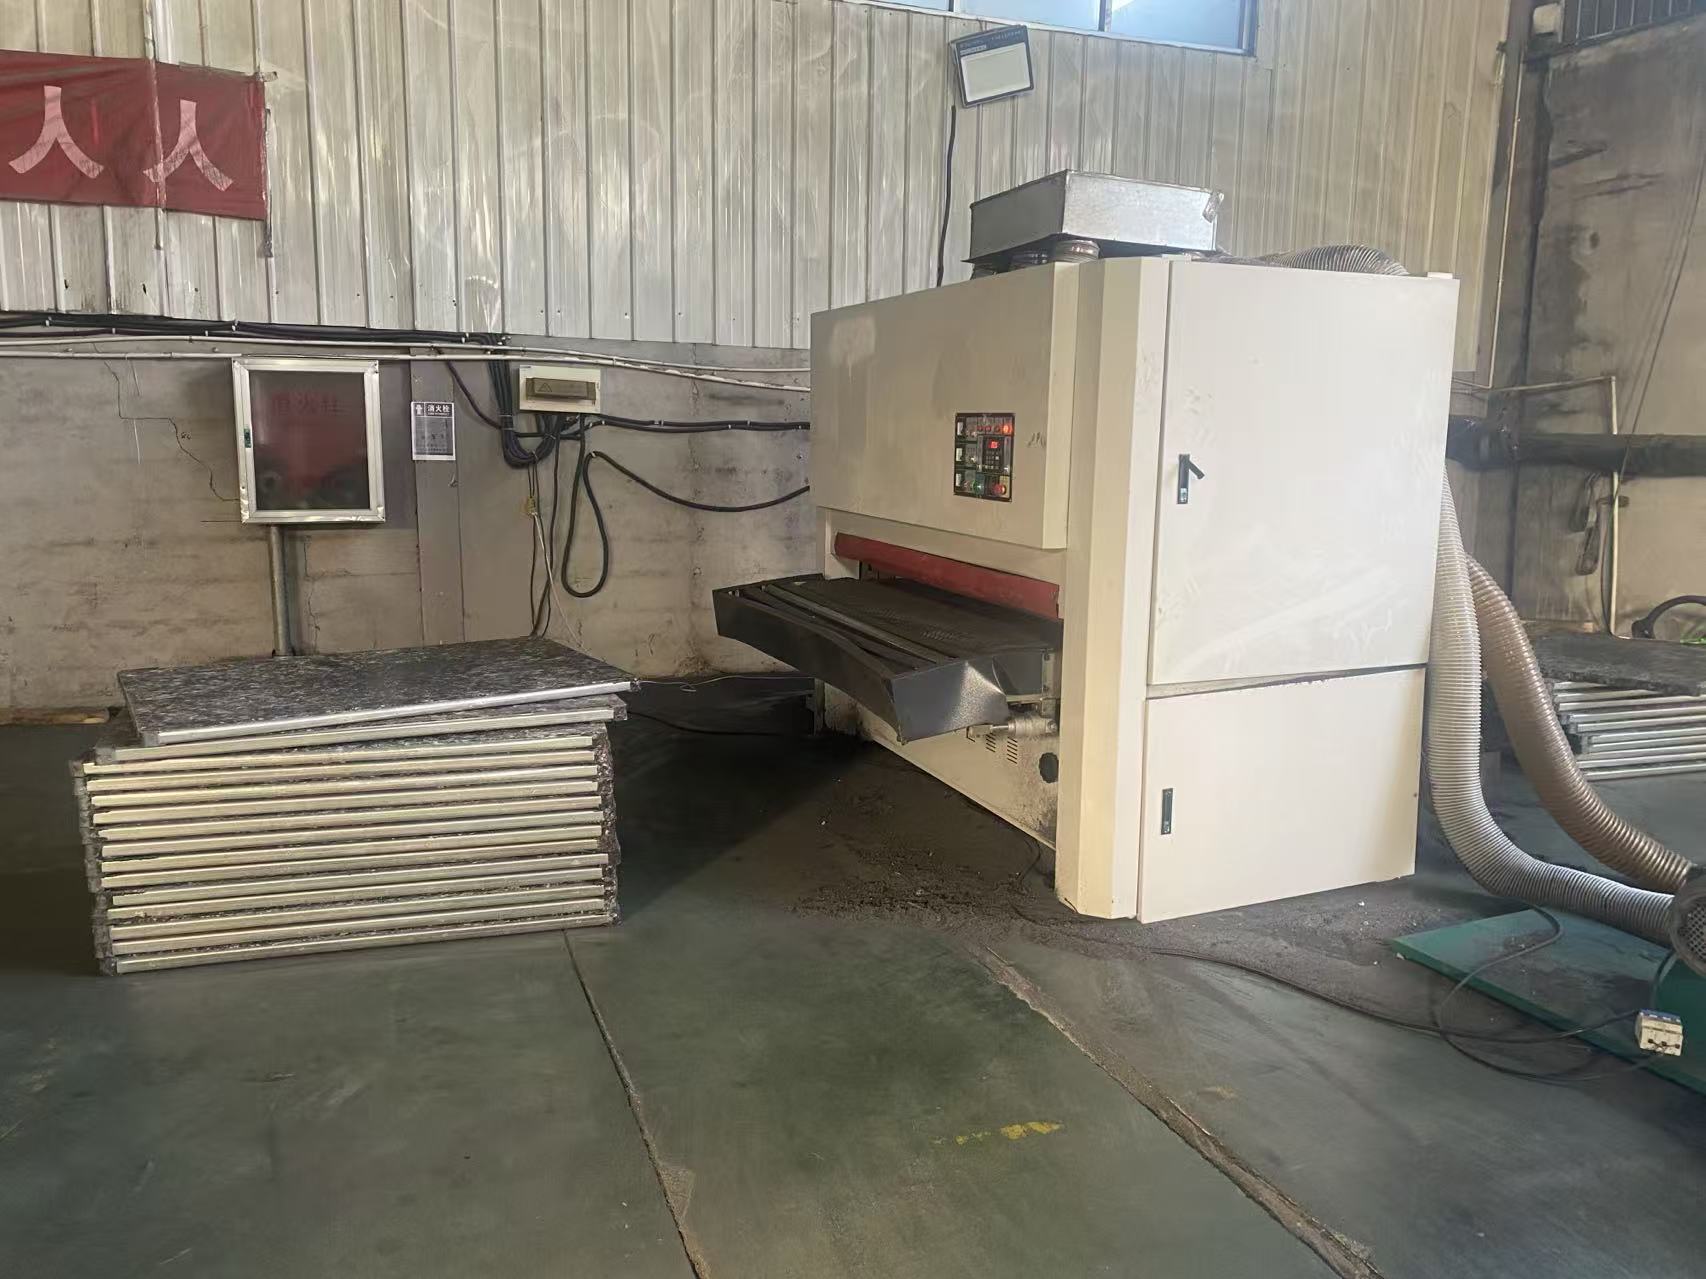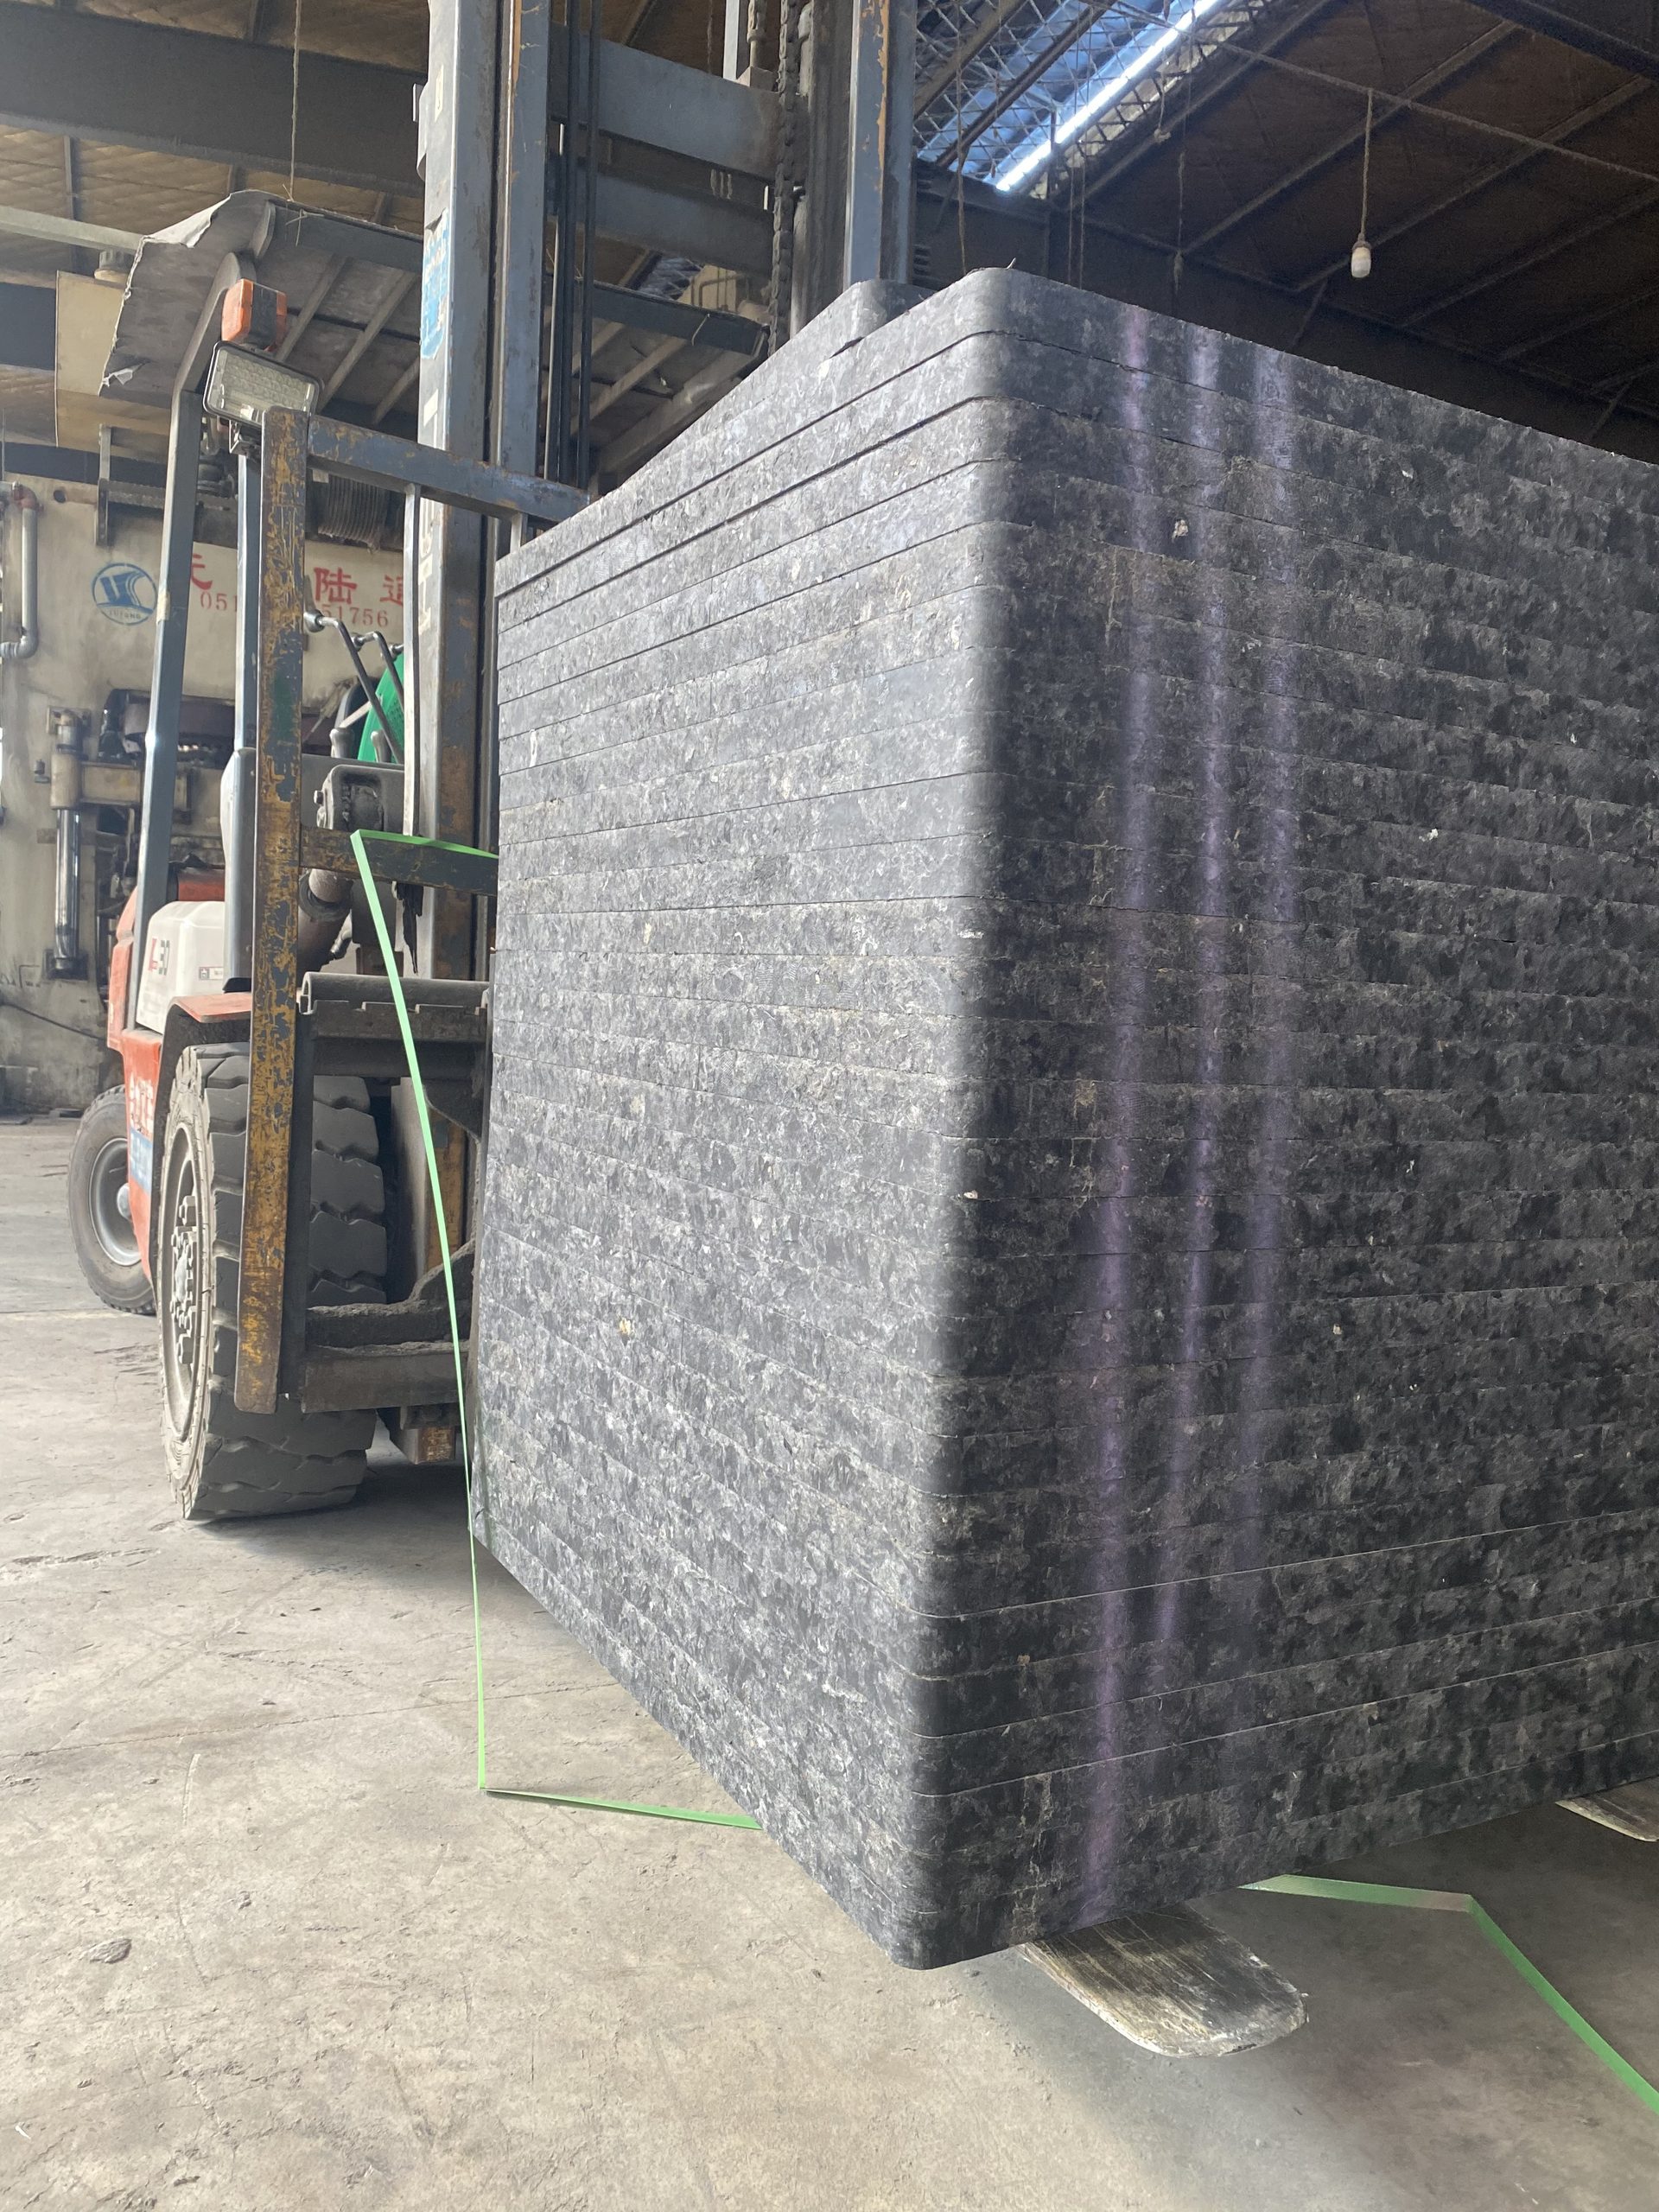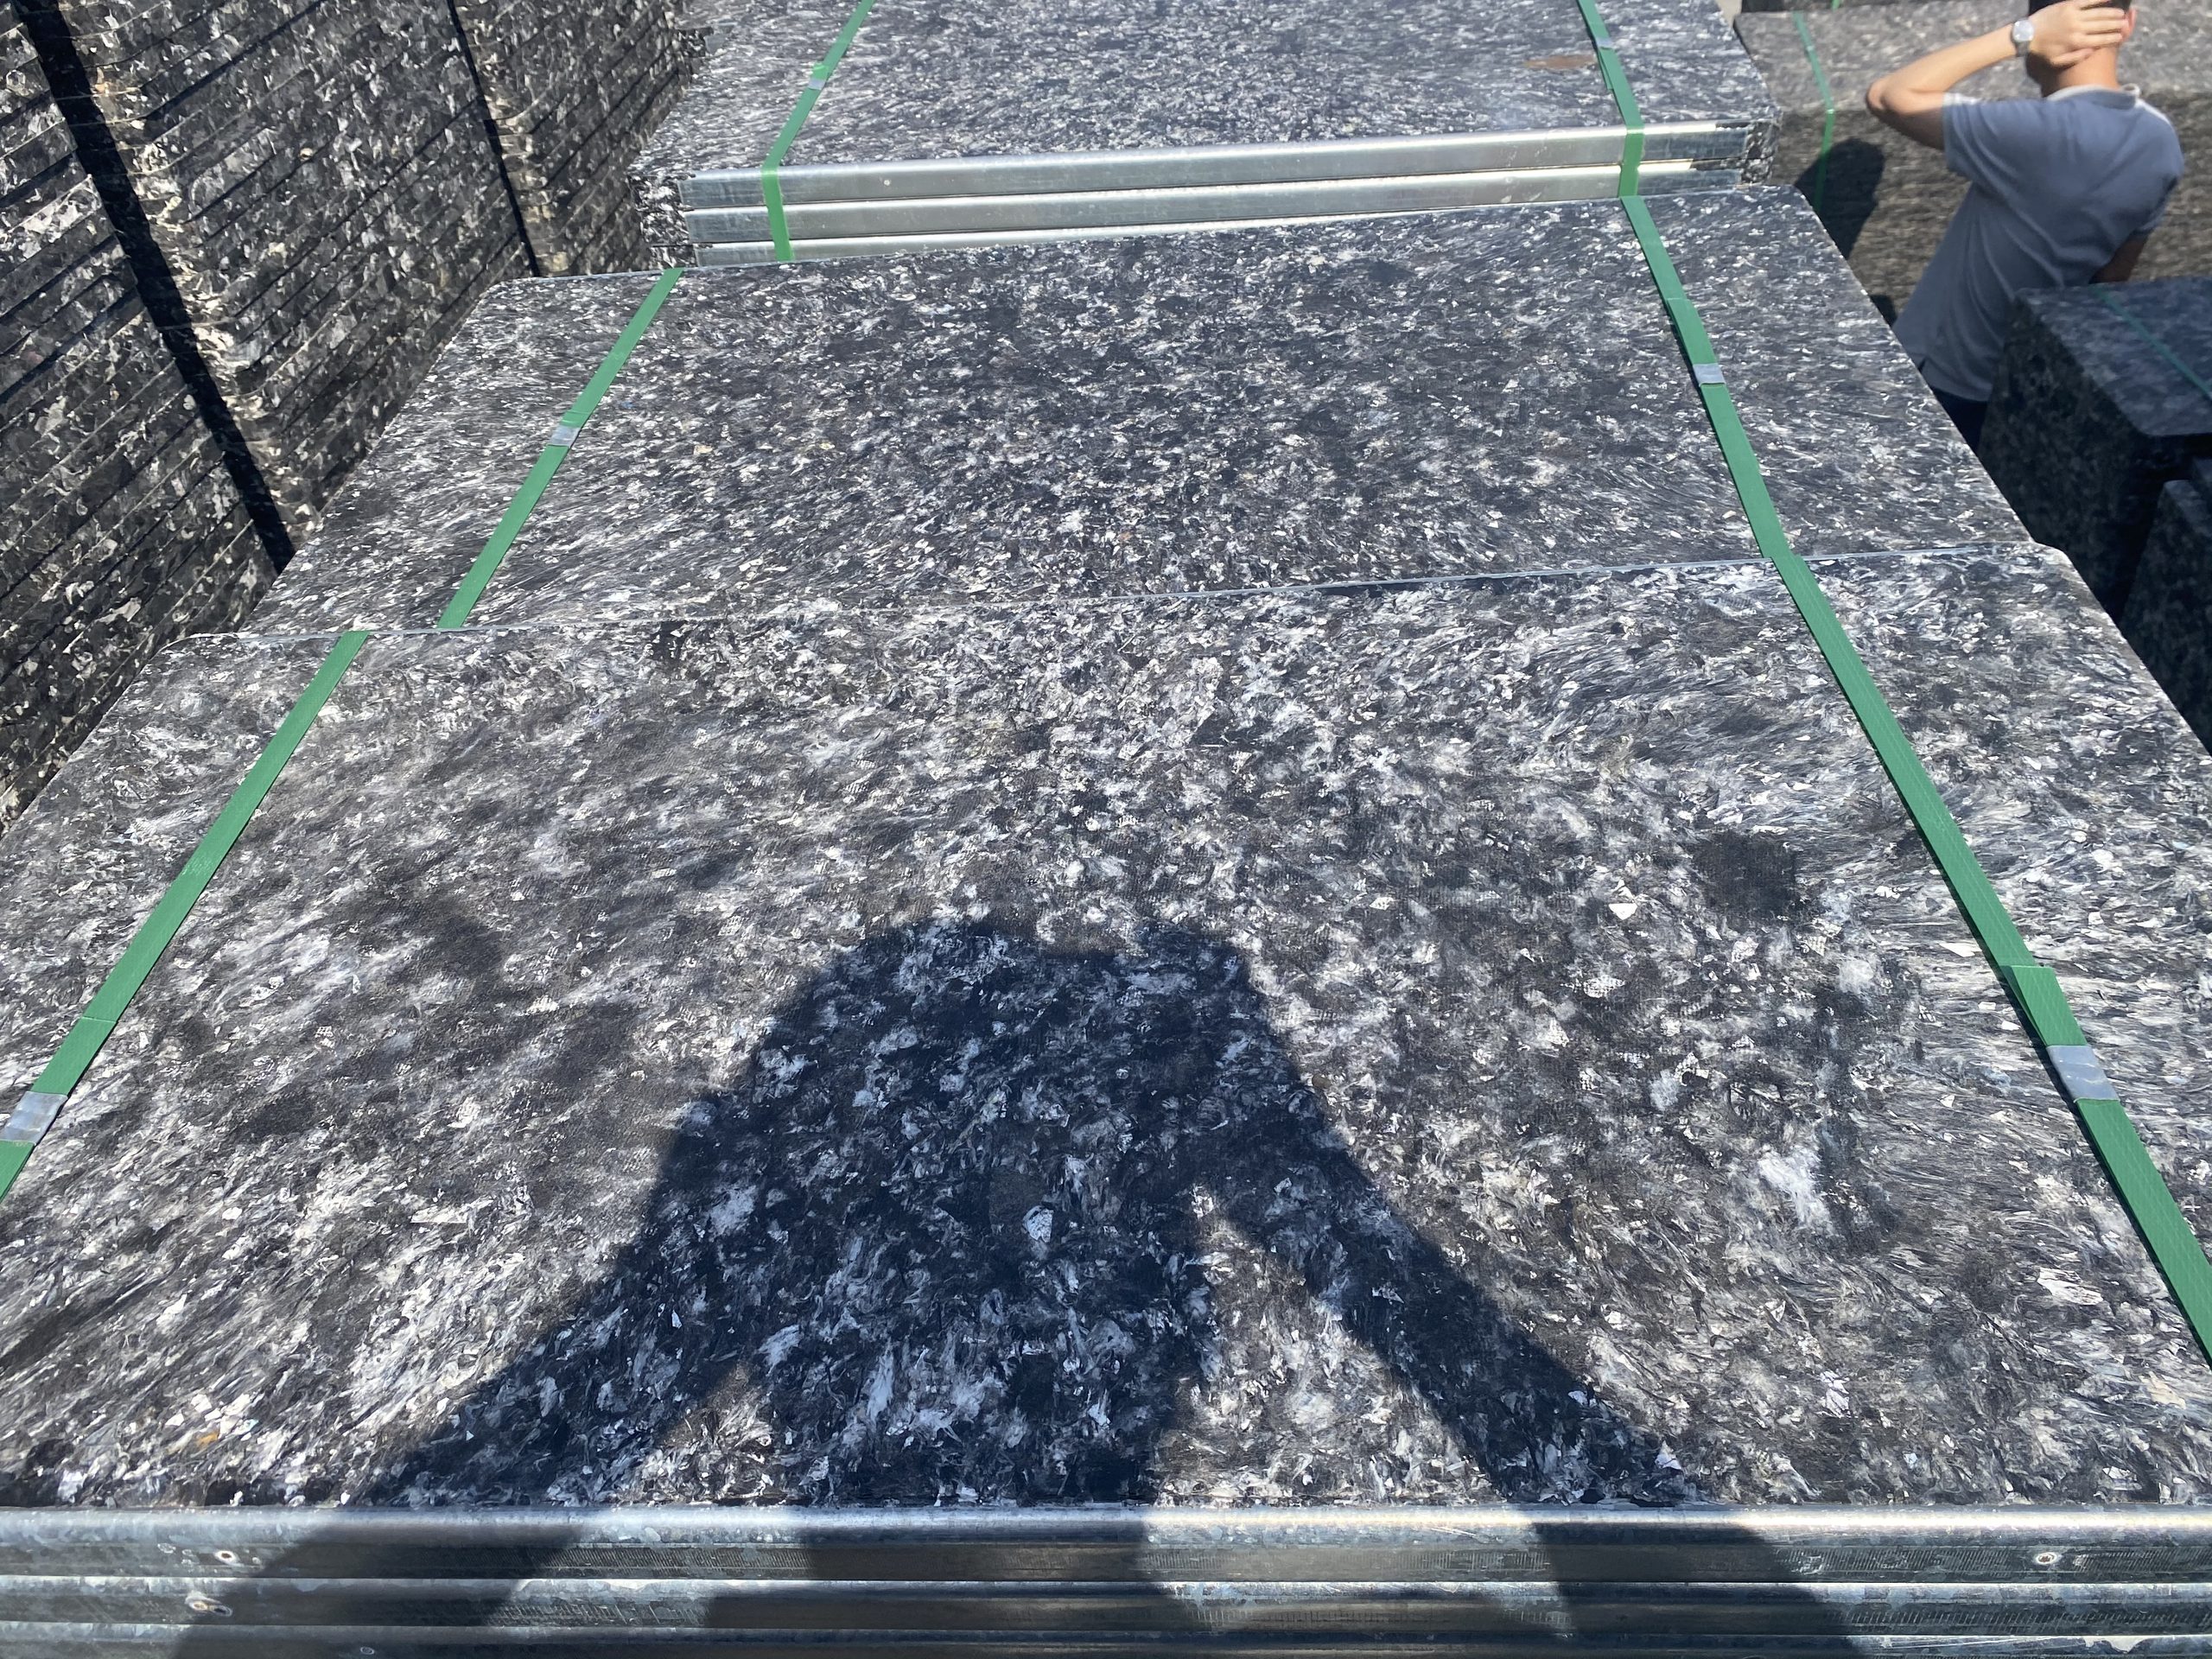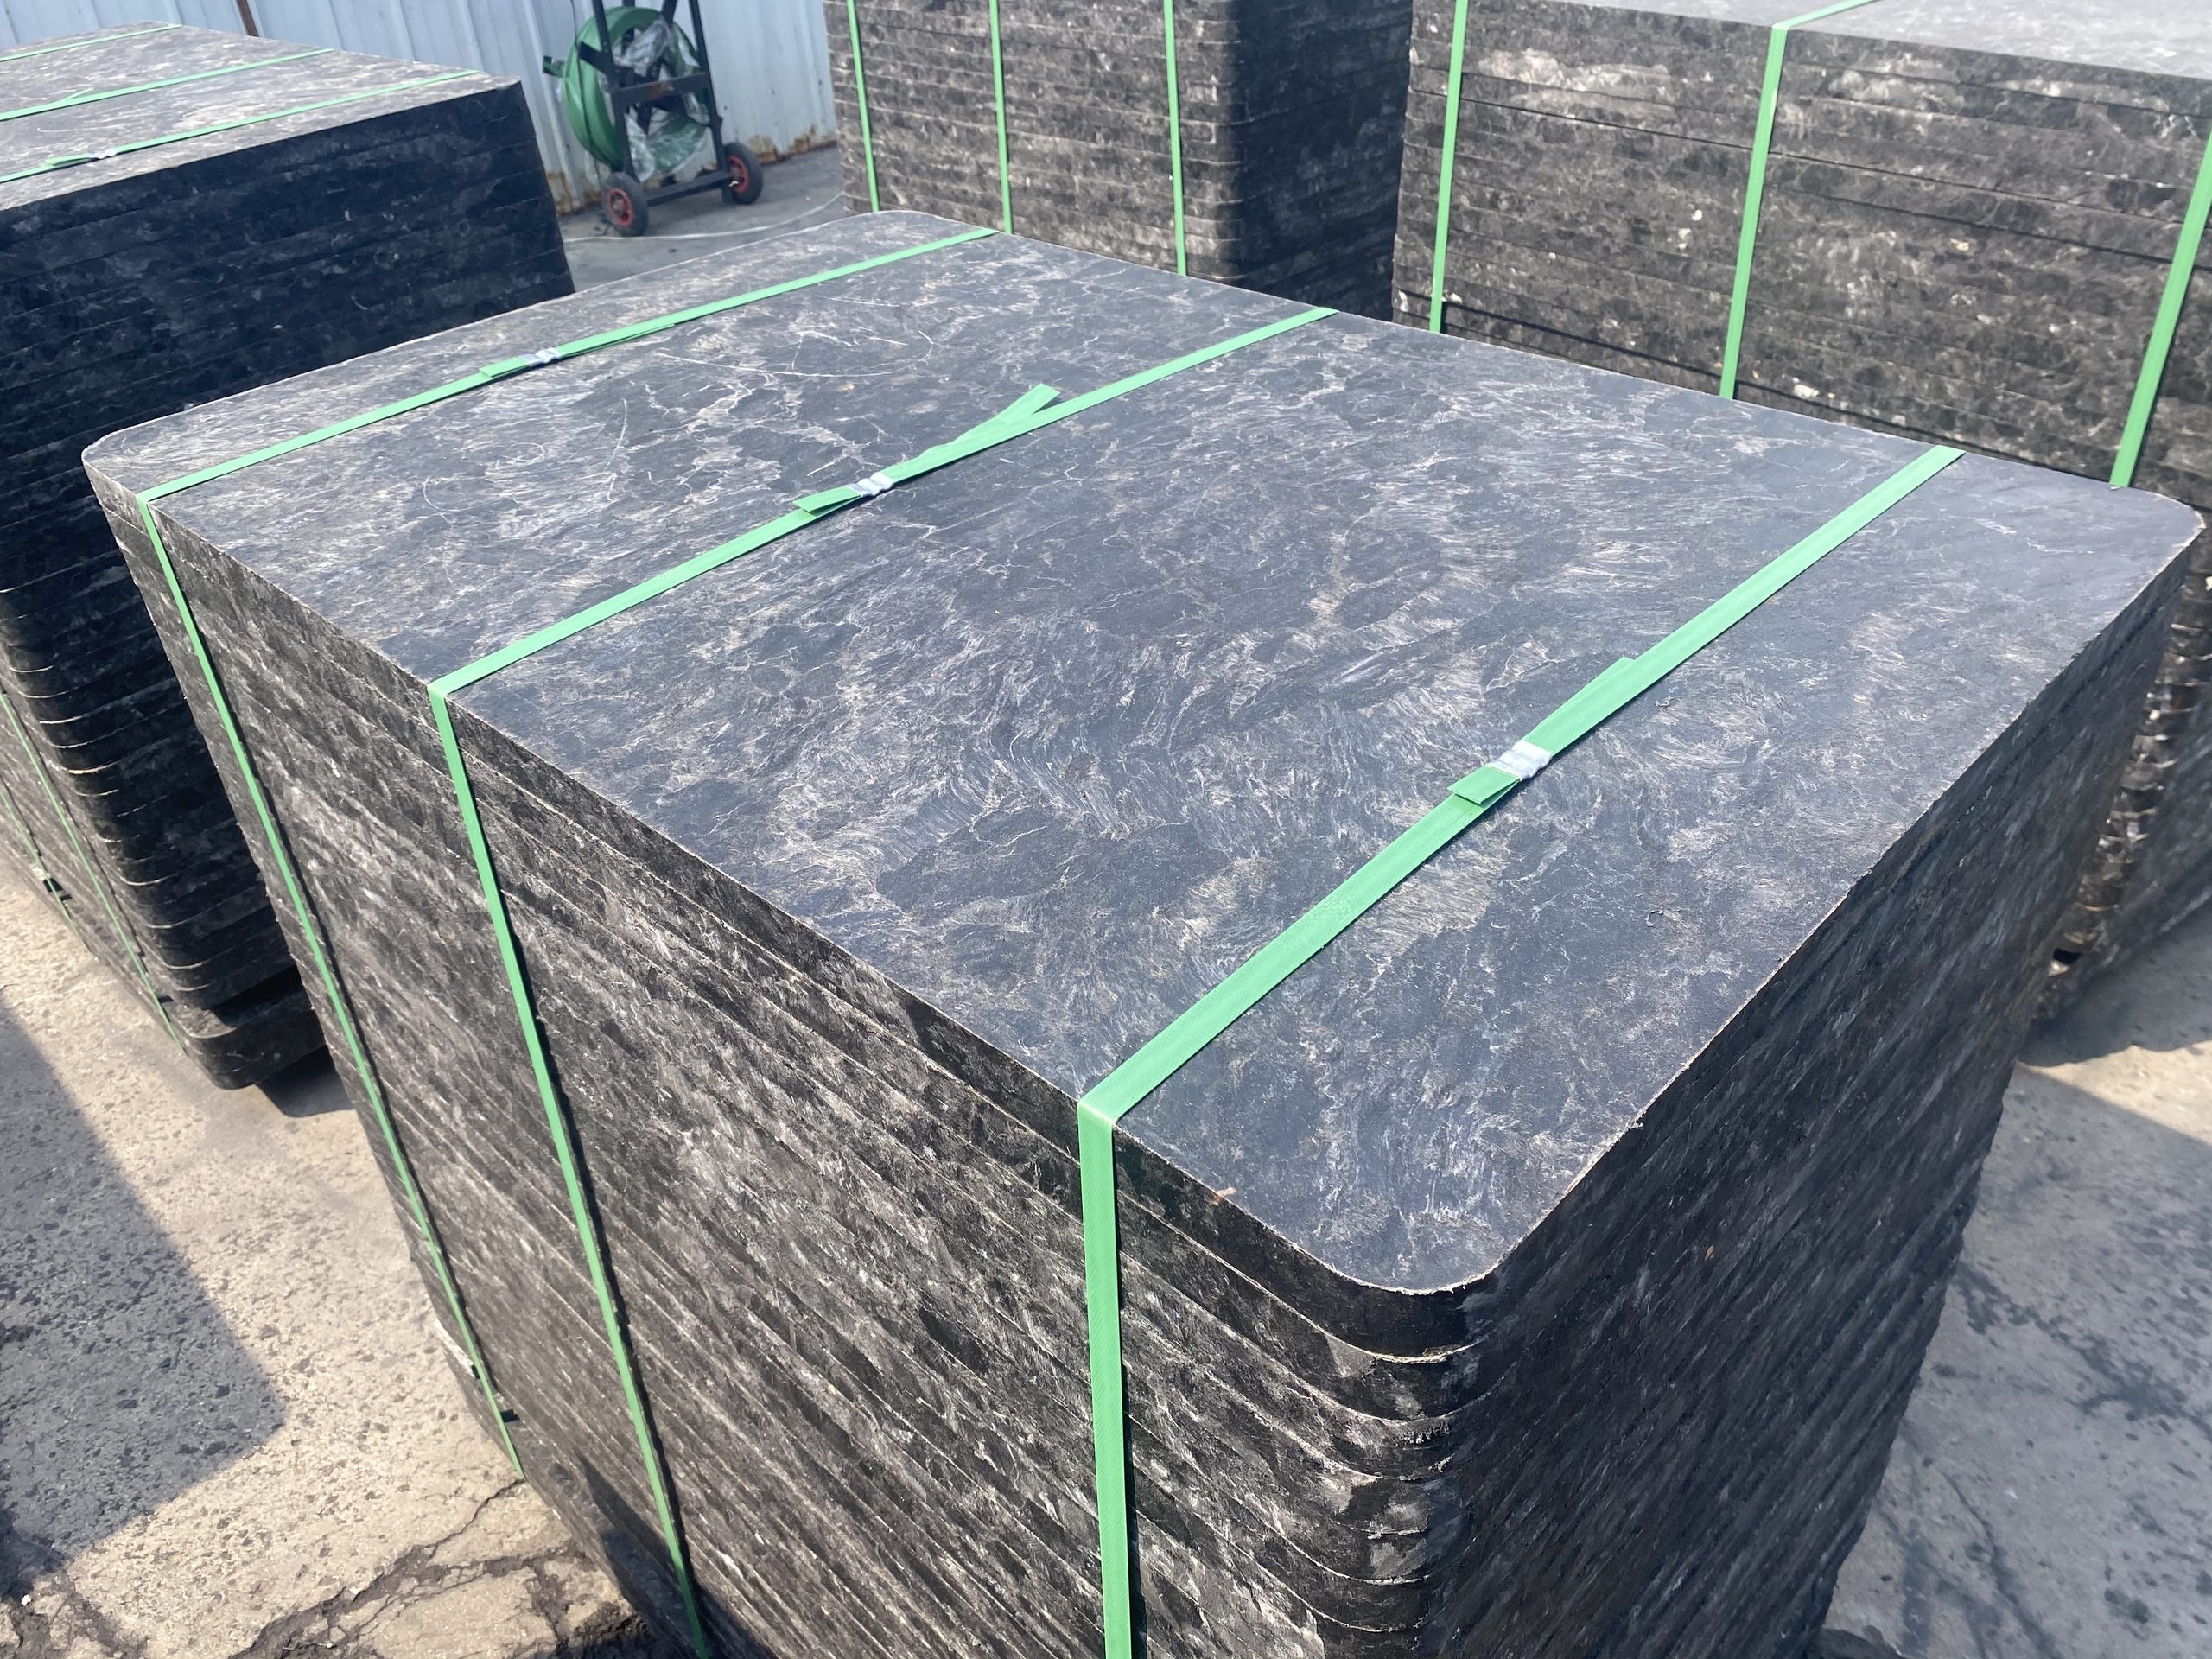
Brick manufacturing contributes approximately 2.6% of global industrial CO₂ emissions, with production equipment and supporting infrastructure adding substantial environmental burden beyond raw material processing. Pallet selection, often viewed as a minor operational decision, directly impacts lifecycle emissions through manufacturing energy, transportation frequency, replacement cycles, and end-of-life disposal. Research shows wood pallets generate 4.12 kg CO₂-eq per unit in production, while plastic alternatives reach 38.85 kg CO₂-eq, yet functional lifespan and replacement frequency shift the long-term environmental equation significantly. Understanding the complete carbon profile of GMT pallets versus traditional options over a 10-year operational period reveals which material choice aligns with sustainability targets without sacrificing production performance.
This guide calculates the real carbon footprint across pallet lifecycles, breaking down manufacturing emissions, transportation impact from replacement frequency, production energy allocation, and offset opportunities. You will understand how to quantify environmental impact in your facility and make data-driven pallet choices that reduce both operational costs and carbon output.
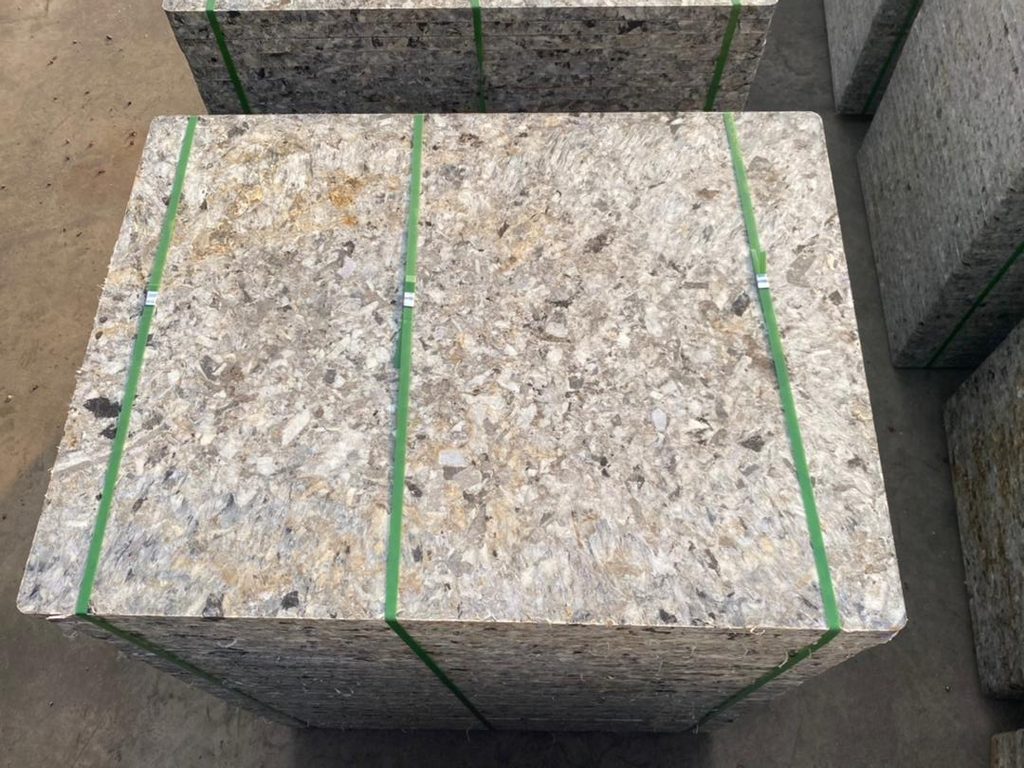
Understanding Lifecycle Carbon Footprint in Pallet Selection
Lifecycle carbon assessment measures total greenhouse gas emissions from raw material extraction through manufacturing, use phase, and end-of-life disposal. For brick production pallets, this includes polymer or wood sourcing, manufacturing energy requirements, transportation during distribution, operational emissions from handling equipment, and disposal or recycling processes after service life concludes.
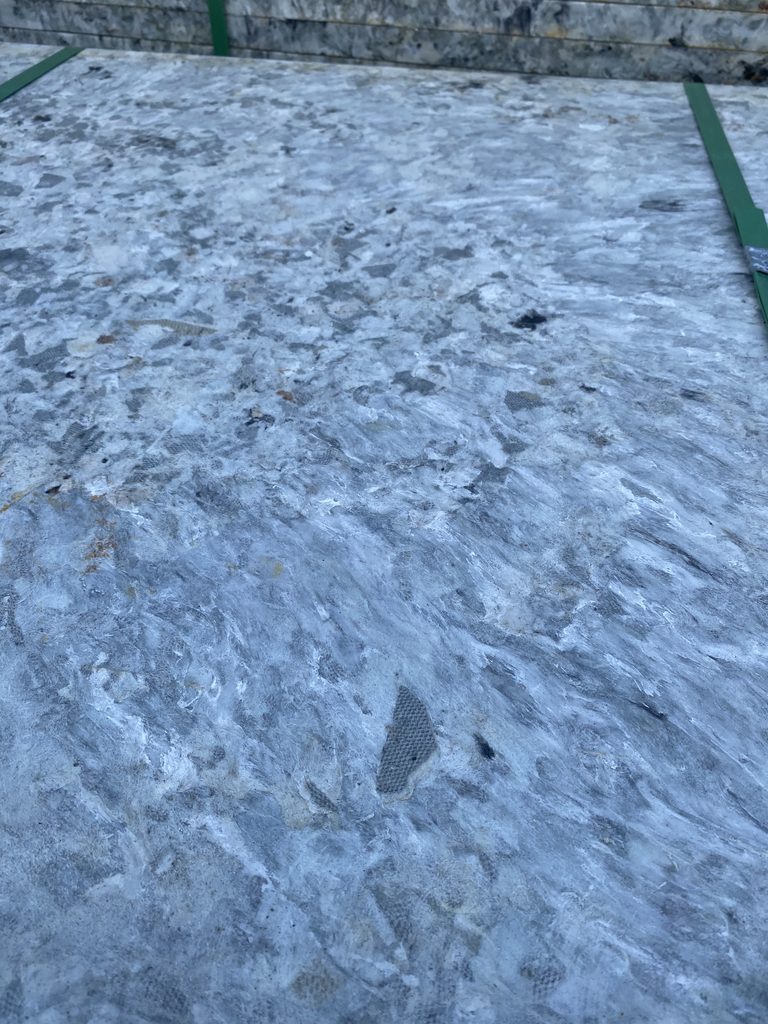
Traditional wood pallets show low cradle-to-gate emissions at 4-6 kg CO₂-eq per unit, but their 2-3 year service life demands frequent replacement. GMT pallets manufactured from glass-reinforced thermoplastic composites require higher initial energy input at 18-25 kg CO₂-eq per unit during production, yet their 10-12 year lifespan distributes this impact across 3,000-5,000 operational cycles. The functional unit for accurate comparison is emissions per 1,000 brick transport cycles rather than per-pallet manufacturing emissions.
Attributional lifecycle assessment (LCA) accounts for direct emissions at each stage, while consequential LCA includes indirect market effects like forestry practices for wood pallets or recycled content displacement in composite materials. Studies indicate wood-polymer composites demonstrate 15-30% lower consequential impact when accounting for avoided virgin material production through recycled thermoplastic content.
Manufacturing Emissions: Cradle-to-Gate Comparison
Manufacturing stage emissions vary significantly across pallet materials due to raw material processing requirements and production energy intensity.
| Pallet Type | Raw Material | Manufacturing Energy (MJ/unit) | Cradle-to-Gate CO₂-eq (kg) | Recycled Content (%) |
|---|---|---|---|---|
| Wood (Softwood) | Virgin timber | 85-120 | 4.1-6.2 | 0-5% |
| Wood (Composite) | Recycled wood fiber | 95-140 | 5.8-8.5 | 40-70% |
| GMT (Virgin) | Glass fiber + PP | 280-350 | 22-28 | 0% |
| GMT (Rhinos Pallet) | Glass fiber + recycled PP | 240-310 | 18-24 | 35-50% |
| Plastic (HDPE) | Virgin HDPE | 420-520 | 38-45 | 0% |
Wood pallet production relies primarily on mechanical processing with sawing, planing, and assembly requiring 85-120 MJ energy per unit. Research data shows manufacturing contributes 35% of total lifecycle impact for wood pallets, with raw material sourcing adding 28% and transportation 18%.
GMT pallet manufacturing involves compression molding at 180-220°C with cycle times of 3-5 minutes per unit. Glass fiber mat reinforcement provides the structural strength that extends service life beyond wood and standard plastic alternatives. Energy consumption reaches 240-310 MJ per pallet when incorporating 35-50% recycled polypropylene content, reducing virgin material demand and associated petrochemical refining emissions by 18-25 kg CO₂-eq compared to virgin GMT production.
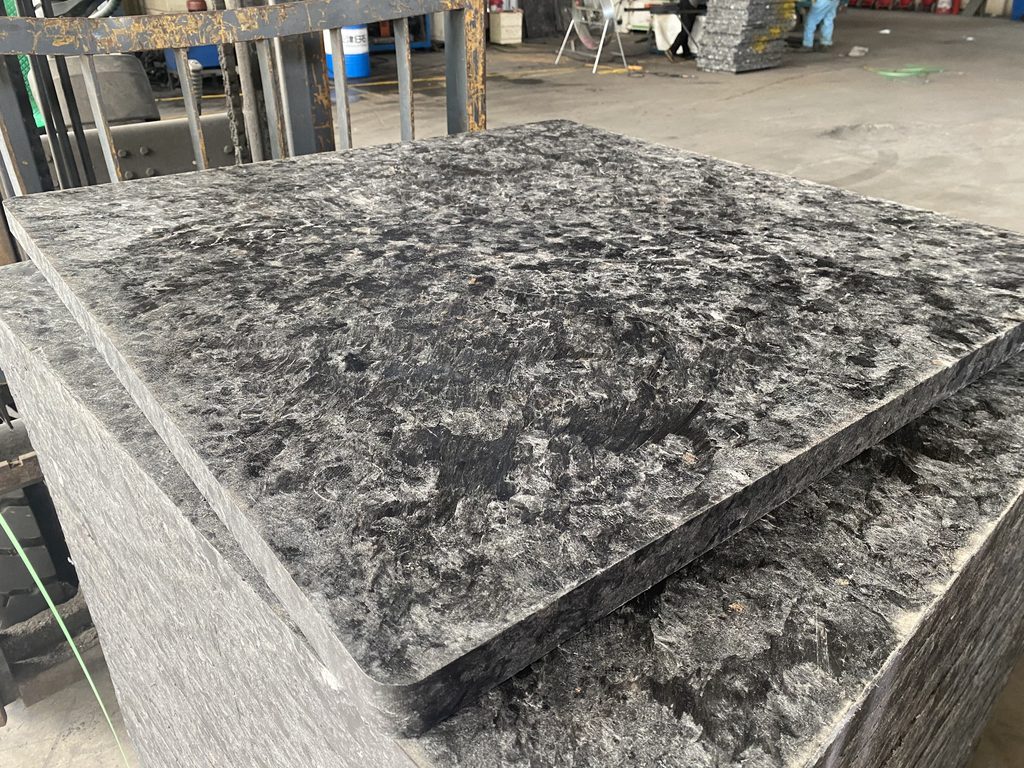
Transportation Impact from Replacement Frequency
Transportation emissions compound significantly when replacement frequency increases. A 200-pallet fleet operating in a brick facility requires different logistics patterns based on material durability.
Wood Pallet Replacement Pattern:
- Annual replacement: 30-38% (60-76 units yearly)
- Transport distance: 150-300 km
- Emissions per delivery: 45-60 kg CO₂-eq
- 10-year cumulative: 2,700-4,560 kg CO₂-eq
GMT Pallet Replacement Pattern:
- Annual replacement: 8-10% (16-20 units yearly)
- Transport distance: 150-300 km
- Emissions per delivery: 12-16 kg CO₂-eq
- 10-year cumulative: 720-960 kg CO₂-eq
Transportation emissions reduction through extended service life generates 1,980-3,600 kg CO₂-eq savings for a 200-unit fleet over 10 years.
Production Energy Allocation Per Pallet Cycle
Brick production consumes 1,200-1,800 kWh electricity per 100,000 units manufactured, with pallet handling and transport systems accounting for 8-12% of facility energy use. Pallet failure rates directly influence production energy efficiency through line stoppages, manual intervention, and reject processing.
GMT pallets maintain dimensional stability within ±2mm tolerance across 3,000-5,000 cycles, while wood pallets show progressive warping that increases handling energy requirements and brick breakage rates.
Energy Impact Per 100,000 Brick Production Cycle:
| Factor | Wood Pallet | GMT Pallet | Energy Savings |
|---|---|---|---|
| Handling equipment energy | 142 kWh | 138 kWh | 4 kWh (2.8%) |
| Line stoppage from warping | 18 kWh | 3 kWh | 15 kWh (83%) |
| Reject processing | 28 kWh | 9 kWh | 19 kWh (68%) |
| Total cycle energy | 188 kWh | 150 kWh | 38 kWh (20.2%) |
Converting energy savings to carbon emissions using global grid average of 0.475 kg CO₂-eq/kWh yields 18.05 kg CO₂-eq reduction per 100,000 brick cycle. A facility producing 2.4 million bricks annually saves 433 kg CO₂-eq yearly in production energy alone through GMT pallet adoption, accumulating to 4,330 kg CO₂-eq over 10 years.
This operational carbon reduction compounds with lower manufacturing and transportation emissions to shift total lifecycle carbon profile decisively toward composite pallets despite higher initial production impact.
End-of-Life Emissions and Disposal Pathways
End-of-life treatment determines final carbon accounting for pallet materials. Disposal pathways include landfilling, incineration with energy recovery, mechanical recycling, and downcycling to lower-grade applications.
Wood Pallet End-of-Life:
- Landfill: 12-18 kg CO₂-eq (methane emissions)
- Incineration: -8 to -2 kg CO₂-eq (energy offset)
- Recycling to mulch: 3-5 kg CO₂-eq
- Pathway distribution: 45% landfill, 35% incineration, 20% recycling
GMT Pallet End-of-Life:
- Landfill: 0.5-1 kg CO₂-eq (transport only)
- Incineration: -12 to -6 kg CO₂-eq (higher energy value)
- Mechanical recycling: 4-7 kg CO₂-eq
- Pathway distribution: 15% landfill, 25% incineration, 60% recycling
Composite pallet recycling rates reach 60% in regions with established thermoplastic collection infrastructure, compared to 20% for wood pallets. Studies demonstrate end-of-life phase contributes 5-39% of total FRP composite carbon footprint depending on recovery pathway availability.
10-Year Carbon Footprint Calculation Model
Complete lifecycle carbon calculation requires summing manufacturing, transportation, operational, and end-of-life emissions across the functional lifespan. The following model applies to a 200-pallet brick production facility processing 2.4 million bricks annually.
Wood Pallet 10-Year Carbon Footprint:
- Manufacturing: 600-760 units purchased × 5.2 kg CO₂-eq = 3,120-3,952 kg CO₂-eq
- Transportation: 60-76 deliveries × 48 kg CO₂-eq = 2,880-3,648 kg CO₂-eq
- Production energy penalty: 260 kg CO₂-eq/year × 10 = 2,600 kg CO₂-eq
- End-of-life: 600 units × 6.5 kg CO₂-eq (weighted average) = 3,900 kg CO₂-eq
Total wood pallet carbon footprint: 12,500-14,200 kg CO₂-eq
GMT Pallet 10-Year Carbon Footprint:
- Manufacturing: 160-200 units purchased × 21 kg CO₂-eq = 3,360-4,200 kg CO₂-eq
- Transportation: 16-20 deliveries × 14 kg CO₂-eq = 224-280 kg CO₂-eq
- Production energy savings: -433 kg CO₂-eq/year × 10 = -4,330 kg CO₂-eq
- End-of-life: 160 units × (-2) kg CO₂-eq (60% recycling scenario) = -320 kg CO₂-eq
Total GMT pallet carbon footprint: -1,066 to +150 kg CO₂-eq
The carbon payback period occurs at 18-24 months when cumulative GMT emissions equal wood pallet emissions, after which every operational year generates net carbon savings. Over 10 years, GMT pallets reduce facility carbon footprint by 12,700-14,350 kg CO₂-eq (90-101% reduction) compared to wood alternatives.
This calculation model assumes grid emission factor of 0.475 kg CO₂-eq/kWh (global average), transport distance of 200 km, recycling rates of wood 20% and GMT 60%, and production volume of 2.4 million bricks annually.
Regional Variations in Carbon Impact
Geographic location influences carbon intensity through grid emission factors, transportation infrastructure, and recycling facility availability.
Grid Carbon Intensity by Region (2026 data):
| Region | Grid Factor (kg CO₂-eq/kWh) | Impact on GMT Advantage |
|---|---|---|
| Europe (EU average) | 0.275 | Reduced production energy savings; 68% total reduction vs wood |
| North America | 0.417 | Moderate production energy savings; 85% total reduction vs wood |
| China | 0.522 | Increased production energy savings; 107% total reduction vs wood |
| Southeast Asia | 0.598 | Highest production energy savings; 115% total reduction vs wood |
| Renewable-heavy grids | 0.085-0.150 | Manufacturing emissions dominate; 45-60% total reduction vs wood |
Coal-heavy grids amplify the carbon benefit of operational energy savings, while renewable-heavy grids reduce but do not eliminate GMT carbon advantage. Recycling infrastructure availability also affects end-of-life carbon accounting, with European markets showing 15-20% larger advantages due to 70-80% composite recycling rates.
Carbon Offset Strategies for Brick Manufacturers
Manufacturers can accelerate carbon neutrality through operational optimization and verified offset programs alongside pallet material selection.
Direct Emission Reduction:
- GMT pallet adoption: 12.7-14.4 tonnes CO₂-eq saved per 200-pallet facility over 10 years
- Kiln efficiency upgrades: 8-15% emissions reduction
- Renewable energy: 45-85% grid emission reduction
- Transport consolidation: 5-12% logistics reduction
A brick facility producing 30 million units annually generates approximately 18,000-24,000 tonnes CO₂-eq in total operations. Pallet-related emissions represent 0.5-0.8% of this total, yet switching to GMT pallets offsets 1.27-1.44 tonnes CO₂-eq per 200-pallet fleet without capital-intensive process modifications.
FAQ
How accurate is lifecycle assessment for comparing pallet carbon footprints?
LCA methodology follows ISO 14040/14044 standards with accuracy dependent on boundary definition and data quality. Manufacturing emissions show ±8-12% variance across studies, transportation impact ±15-20%, and end-of-life scenarios ±25-40% depending on regional infrastructure. Functional unit selection (per pallet versus per 1,000 cycles) changes results significantly, making lifespan assumptions critical for valid comparison.
Do GMT pallets reduce carbon emissions in all production scenarios?
GMT pallets demonstrate carbon advantages in facilities producing 80,000+ bricks monthly where replacement frequency and operational energy dominate total emissions. Very low production volumes (below 30,000 bricks monthly) may not generate sufficient replacement and energy savings to offset higher manufacturing emissions within 10 years. Renewable energy facilities reduce but do not eliminate GMT carbon benefits due to transportation and end-of-life advantages.
What emission factor should I use for my facility?
Use your regional grid emission factor from national energy authorities or IEA databases. If your facility purchases renewable energy certificates or has on-site generation, subtract contracted renewable portion from grid factor. Manufacturing emissions use supplier-specific data when available, otherwise default to 21 kg CO₂-eq per GMT pallet and 5.2 kg CO₂-eq per wood pallet as conservative estimates.
Can recycled content reduce GMT pallet carbon footprint further?
Rhinos Pallet GMT products incorporating 35-50% recycled thermoplastic content reduce manufacturing emissions by 18-25% compared to virgin GMT formulations. Increasing recycled content to 60-70% saves an additional 8-12% but may compromise dimensional stability requirements for brick production applications. Glass fiber remains virgin material due to performance requirements.
How does carbon pricing affect pallet selection decisions?
Carbon pricing at $50-100 per tonne CO₂-eq (current EU ETS range) adds $0.10-0.30 per wood pallet lifecycle cost versus $0.02-0.08 for GMT pallets over 10 years. At $200 per tonne pricing (projected 2030-2035 levels), the gap expands to $0.40-1.20 versus $0.08-0.32, increasing financial incentive for low-carbon alternatives alongside existing ROI benefits.
What data do I need to calculate my facility’s pallet carbon footprint?
Essential data includes: current pallet inventory (units), annual replacement rate (%), production volume (bricks per month), supplier distance (km), local grid emission factor (kg CO₂-eq/kWh), and end-of-life disposal method. Optional data for refined calculation includes handling equipment energy consumption, line stoppage frequency from pallet defects, and actual supplier manufacturing emissions reports.
Conclusion
Lifecycle carbon assessment reveals that initial manufacturing emissions represent only 18-28% of total pallet environmental impact when accounting for replacement frequency, operational energy allocation, and end-of-life treatment over 10-year service periods. GMT pallets demonstrate 90-115% carbon footprint reduction compared to wood alternatives in brick production facilities through extended service life (10-12 years versus 2-3 years), reduced transportation from replacement cycles, operational energy savings from dimensional stability, and higher recycling rates at end-of-life.
The carbon payback period for GMT pallet adoption occurs within 18-24 months, after which each production year generates cumulative carbon savings while simultaneously delivering cost reductions through lower replacement purchases and reduced brick breakage.
If you need long-lasting brick pallets for sustainable manufacturing operations, Rhinos Pallet offers fiber-reinforced GMT pallets with 10+ year lifespan and 35-50% recycled thermoplastic content. Our composite construction reduces facility carbon footprint while providing superior dimensional stability, moisture resistance, and production efficiency for automated and manual brick making operations worldwide.
Contact us today for facility-specific carbon footprint calculations and custom GMT pallet solutions that support your sustainability targets.