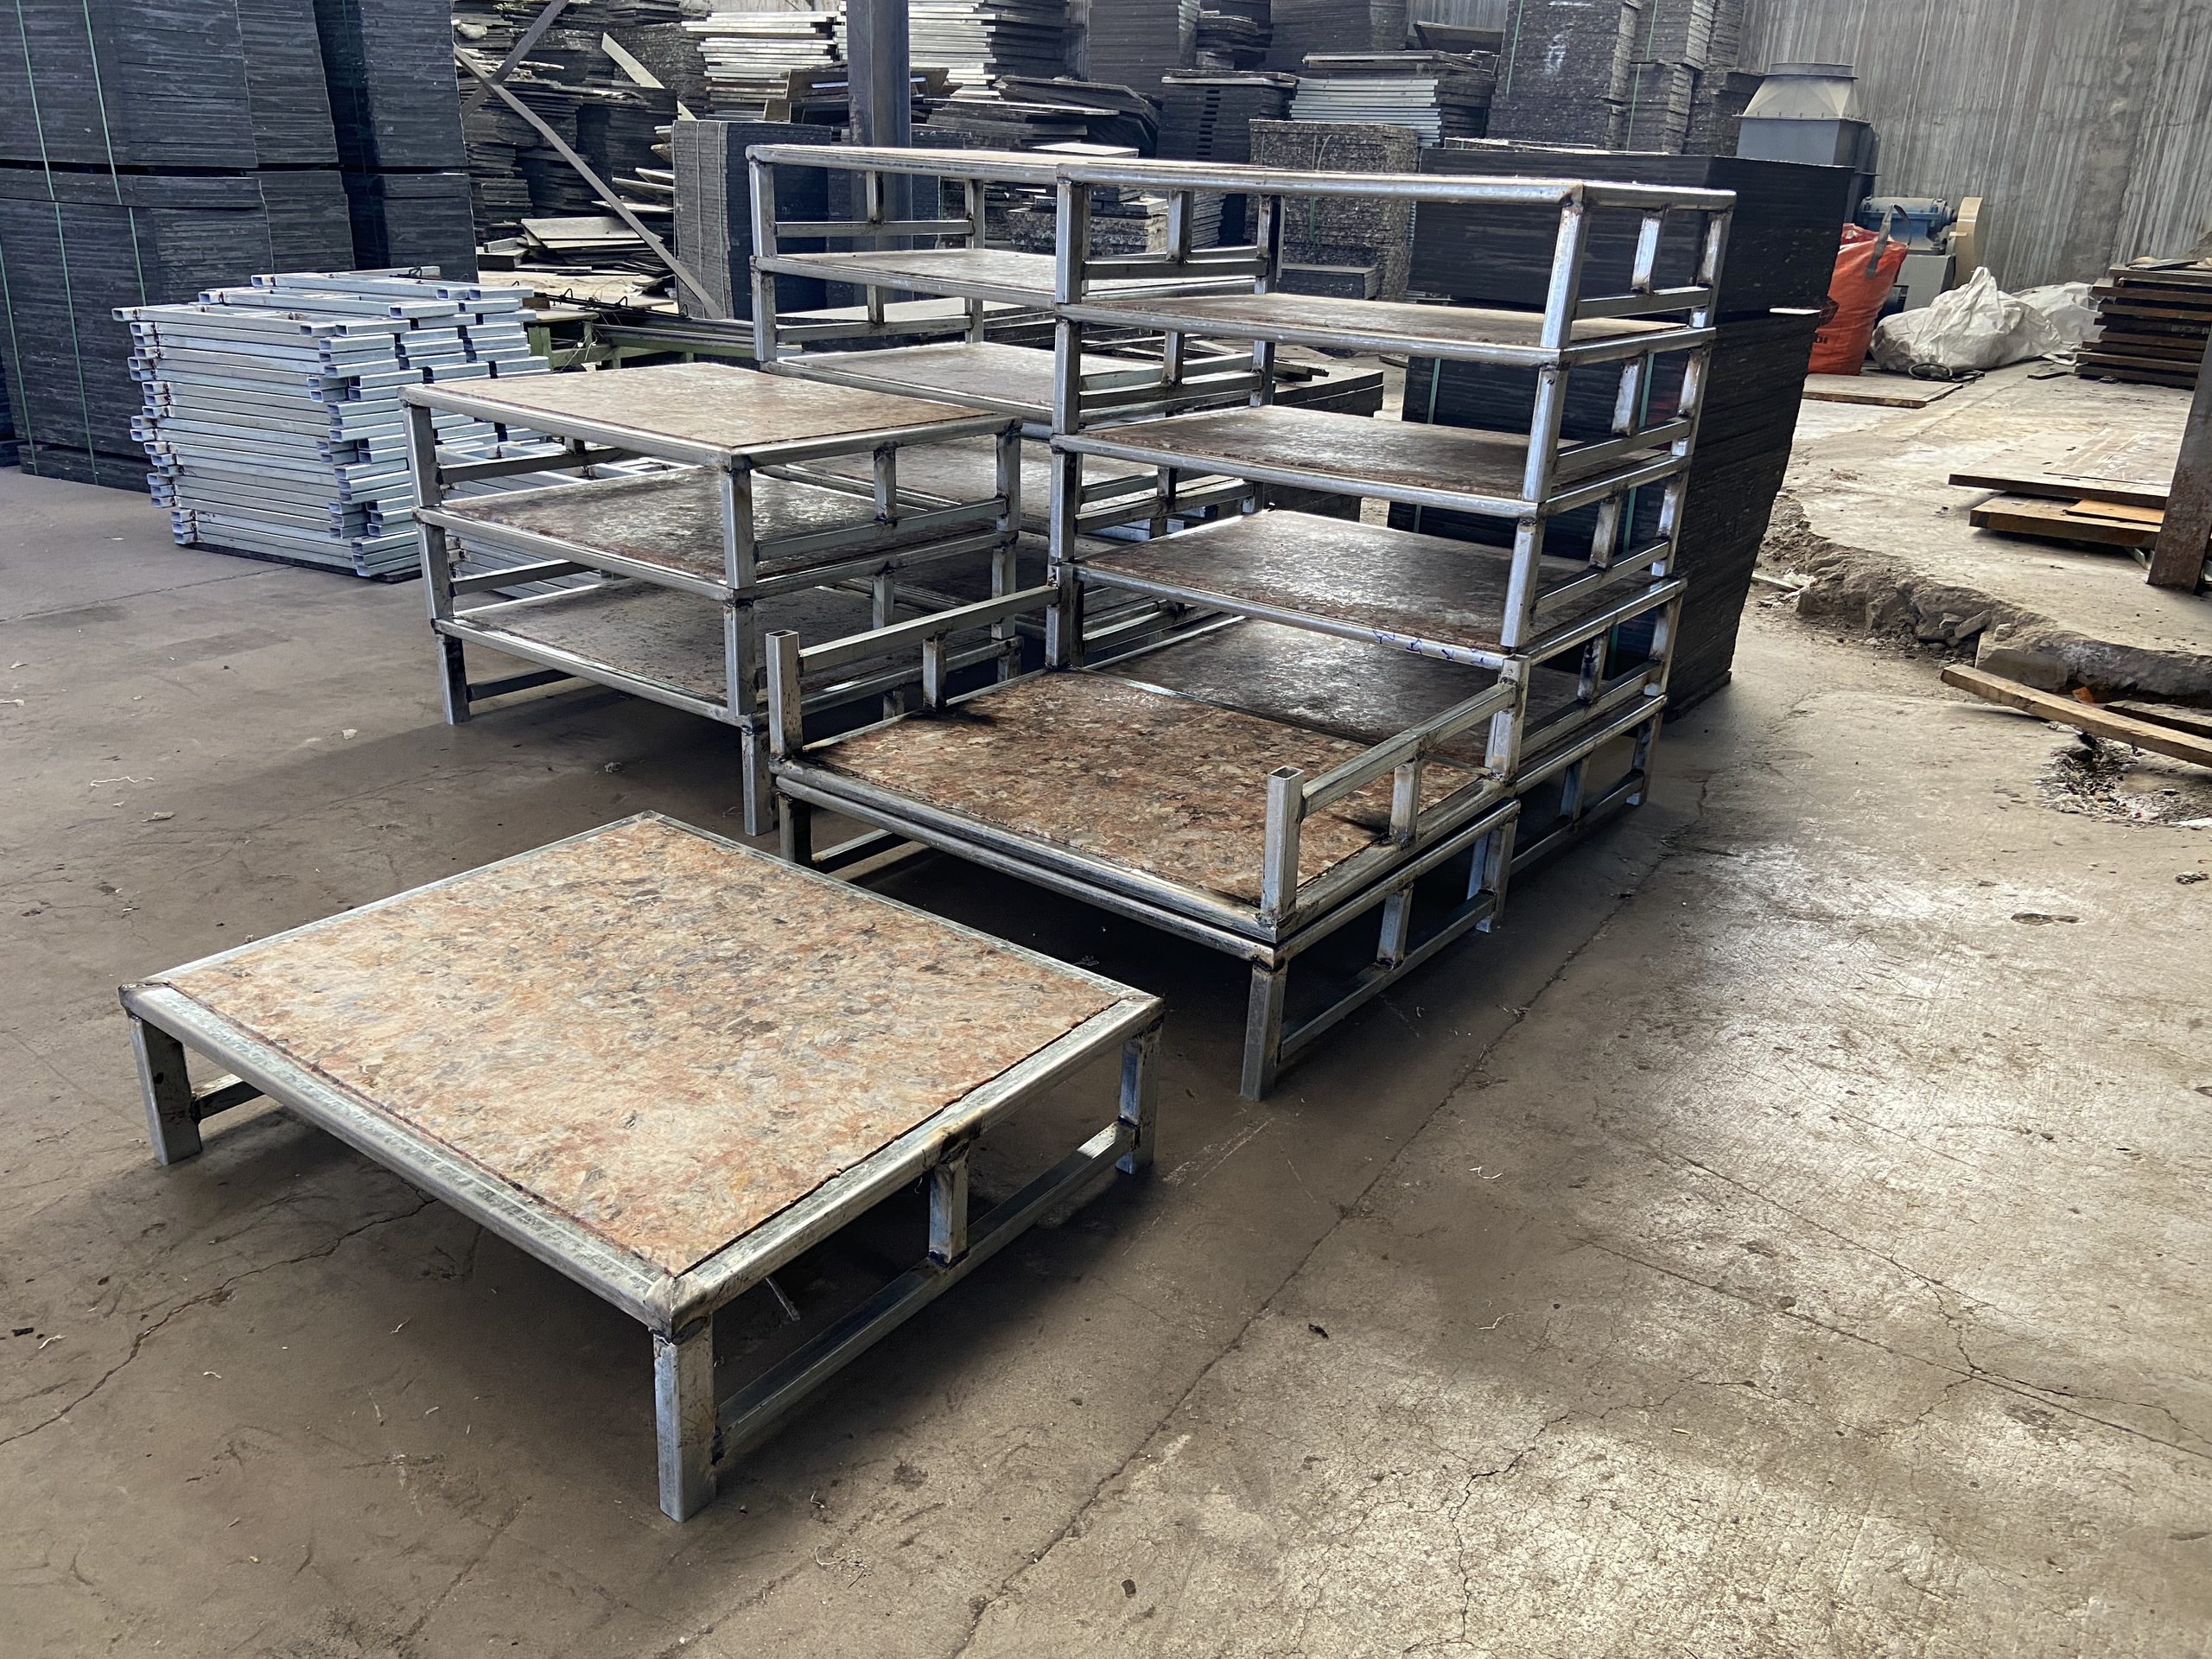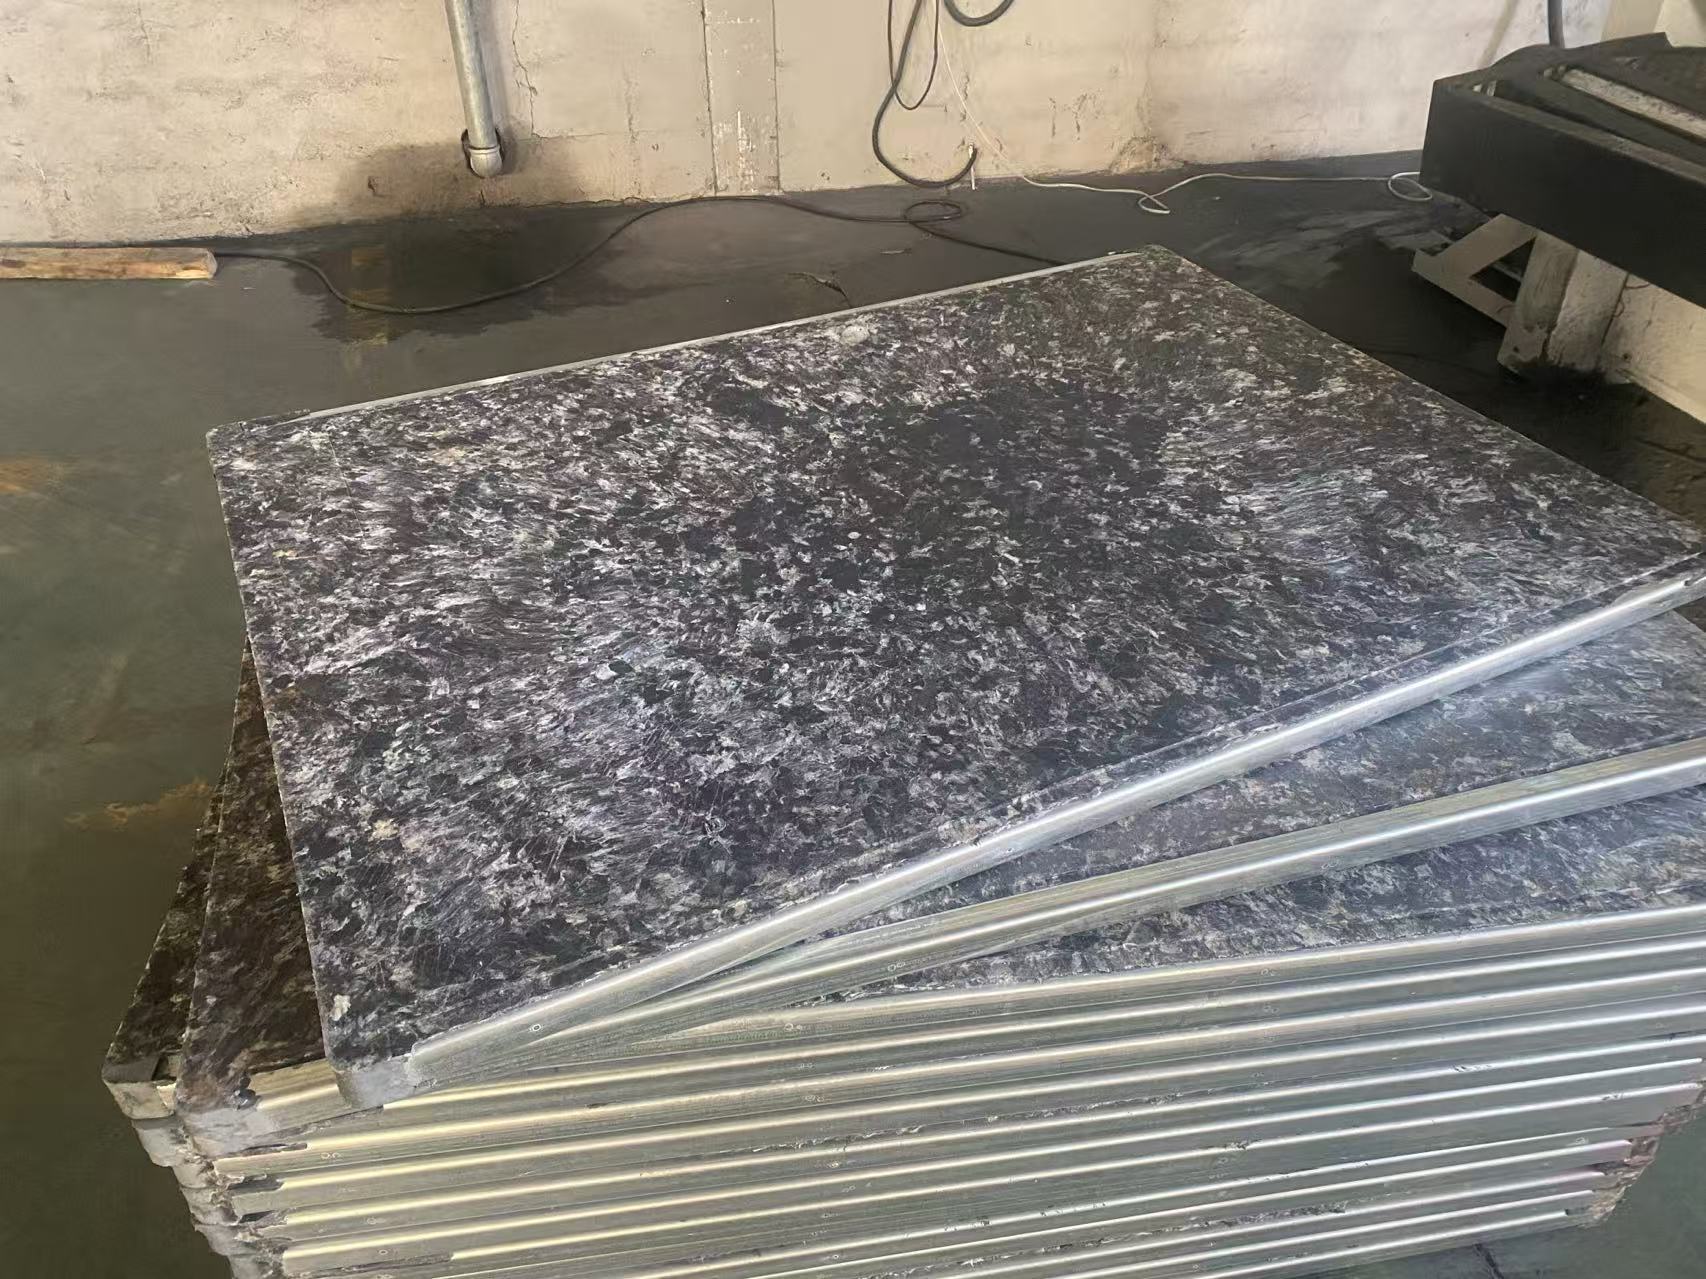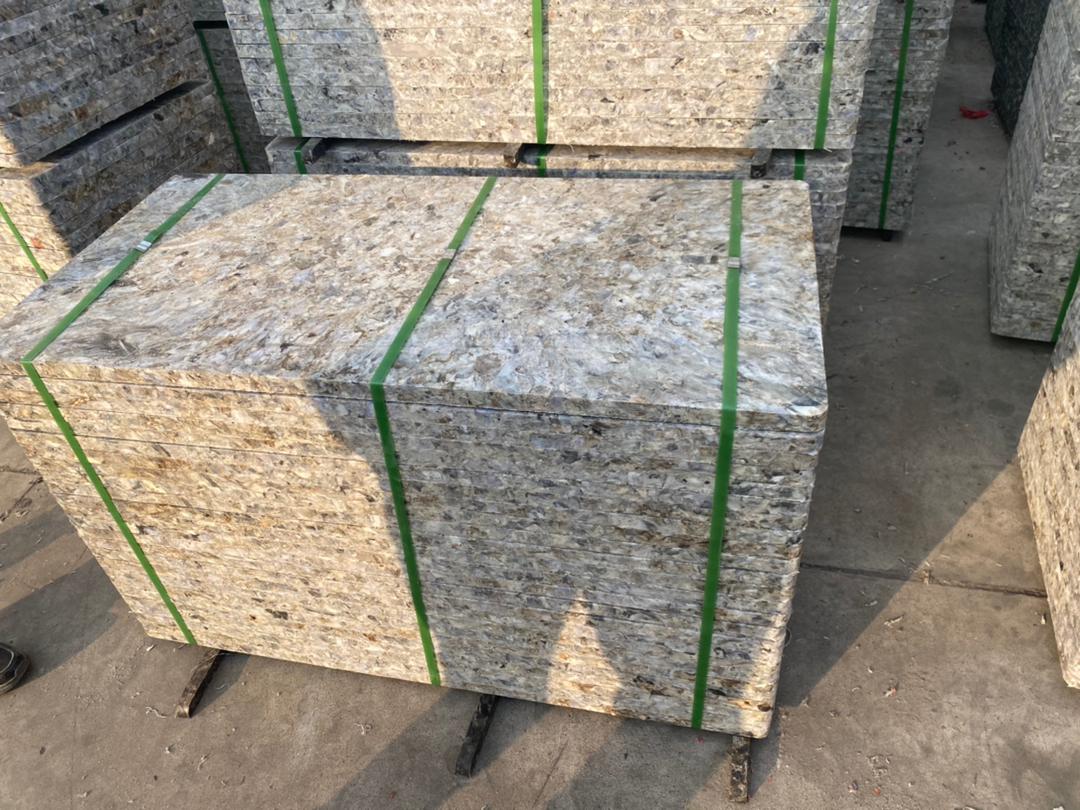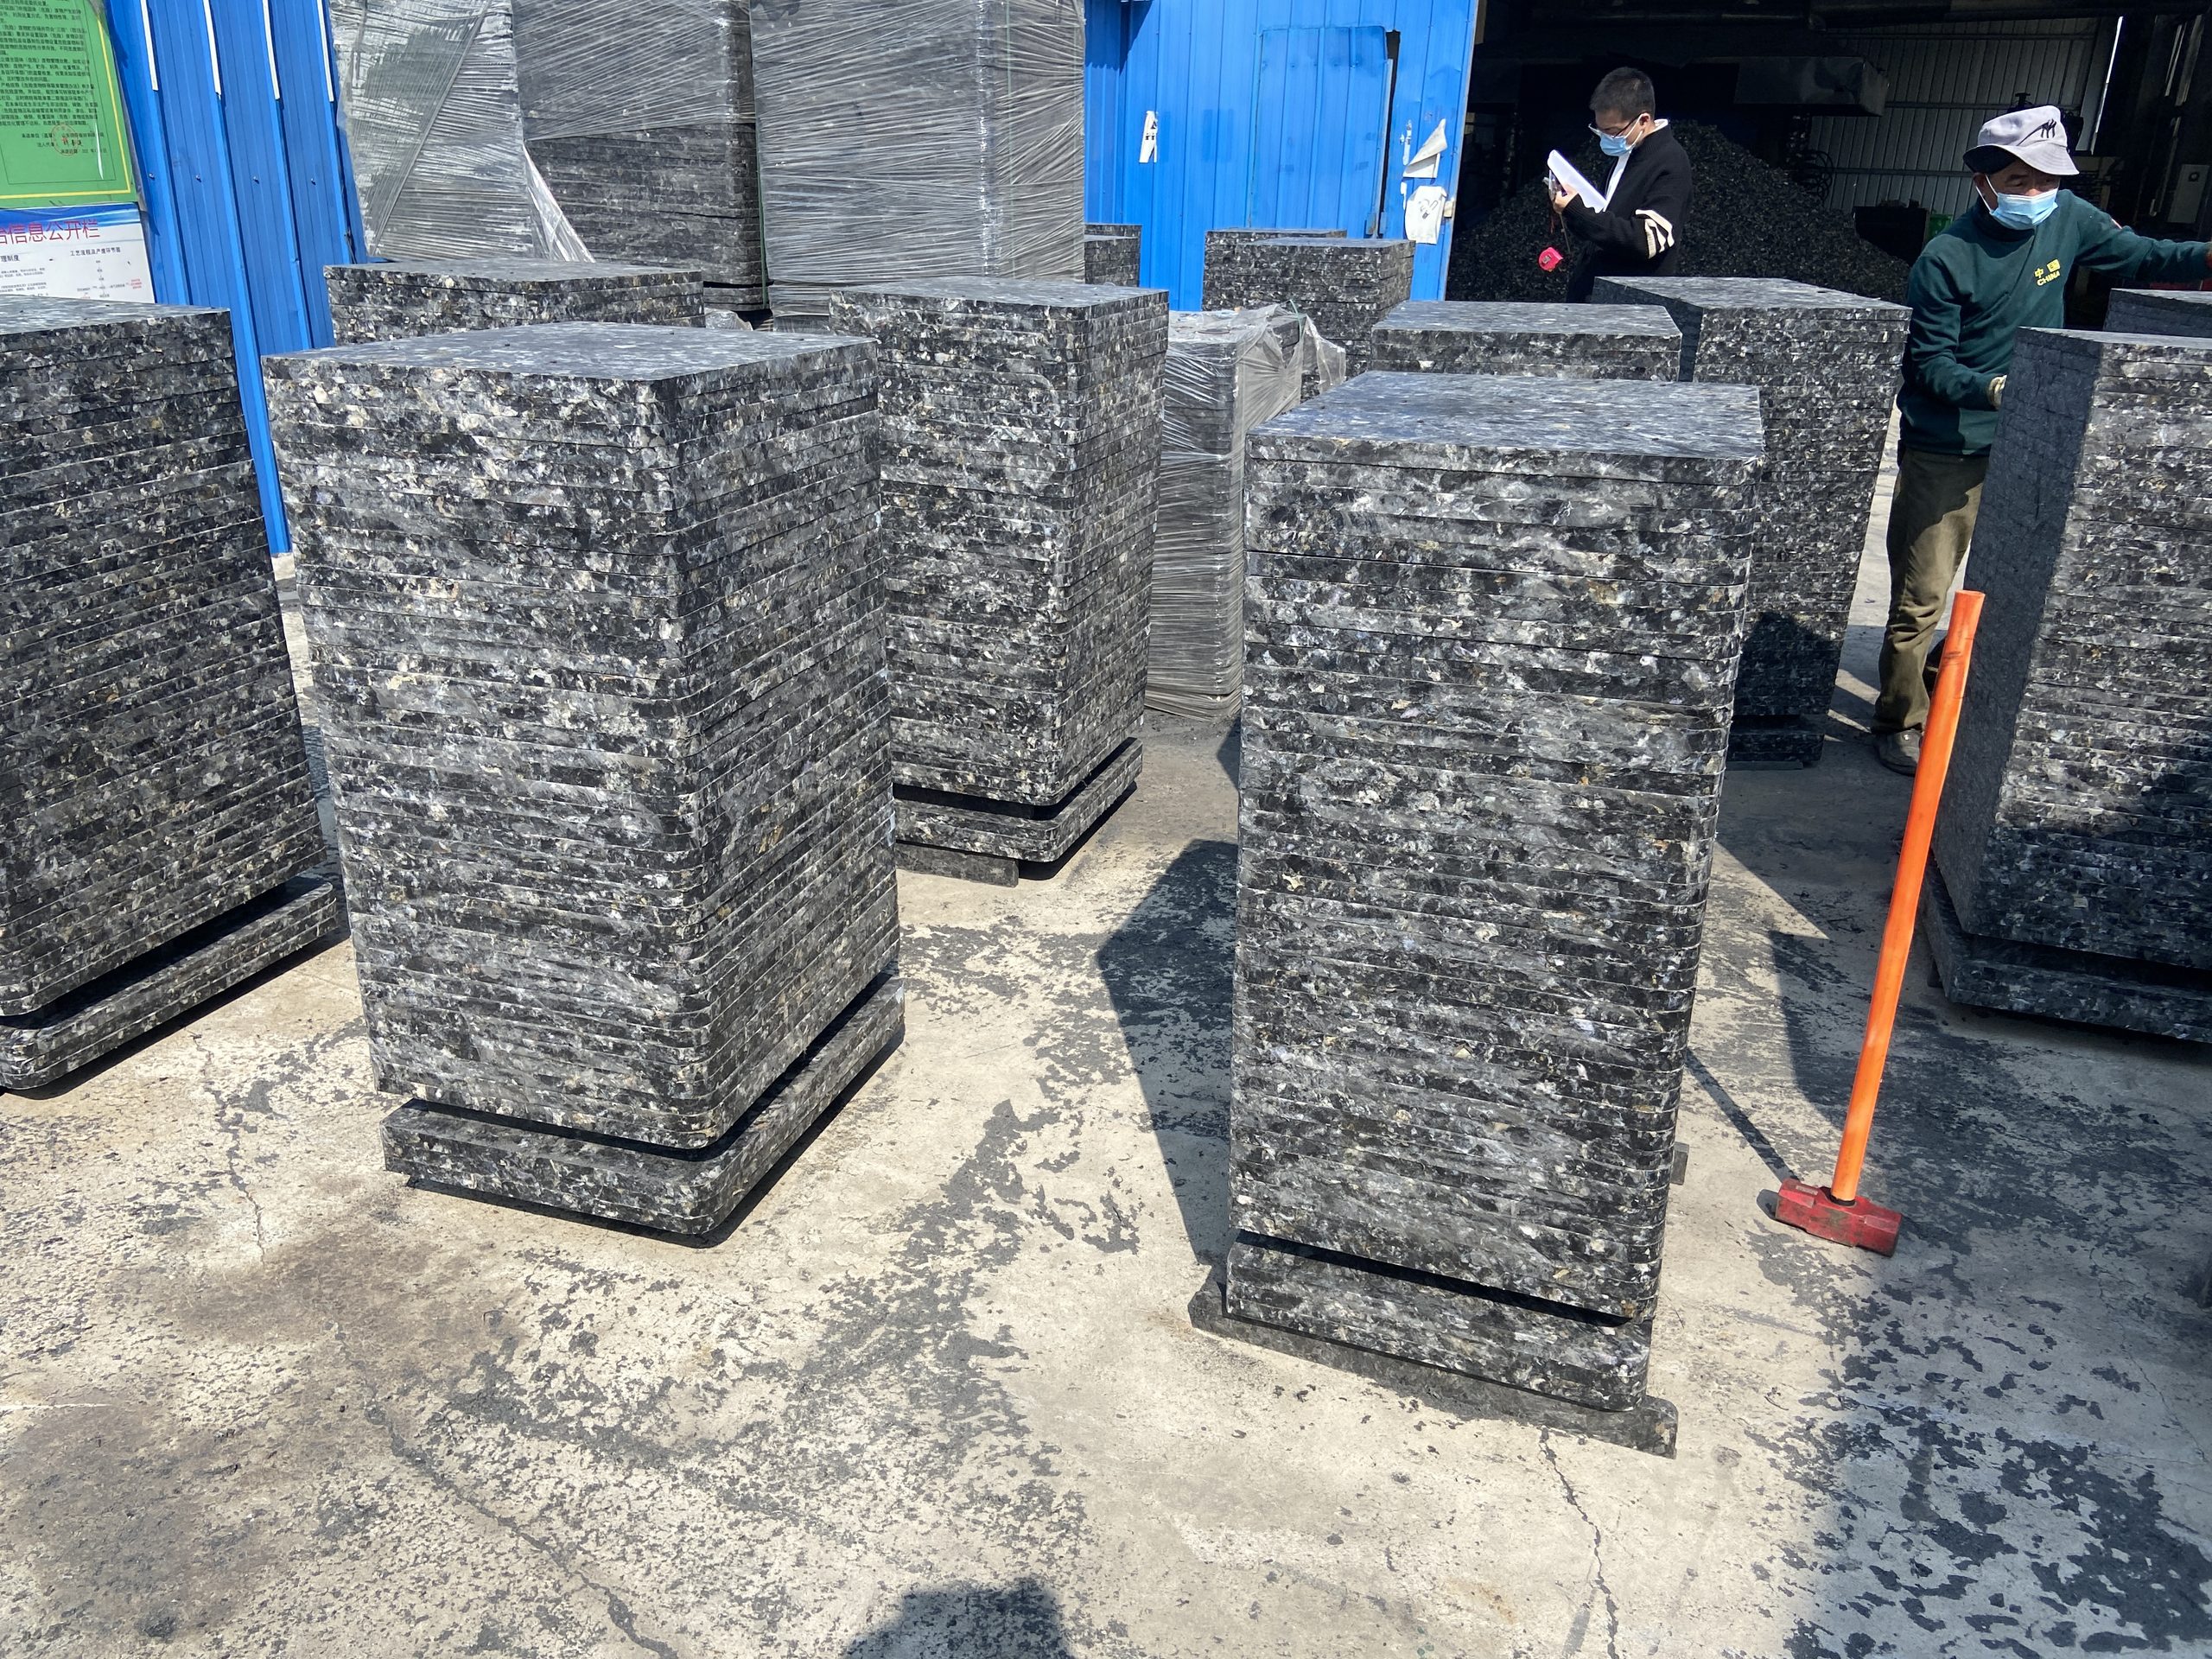
Most brick manufacturers stall at the price comparison. A $35 wood pallet sits next to a $110 GMT pallet on the quote sheet, and the decision feels obvious. That calculation ignores the three cost drivers that actually determine payback: replacement frequency, the labor hours spent fixing warped surfaces, and the brick losses traced back to dimensional inconsistency. Real facility data from plants running 100,000 to 400,000 bricks monthly shows GMT pallet break-even timelines between 8 and 14 months, not the “never” implied by an upfront price gap.
This guide presents the break-even worksheet production managers use to justify the switch: the cost categories wood hides, the timeline factors that move your payback date, a worked calculation from a 200-pallet operation, and the production volume thresholds where GMT pallets recover their investment fastest.
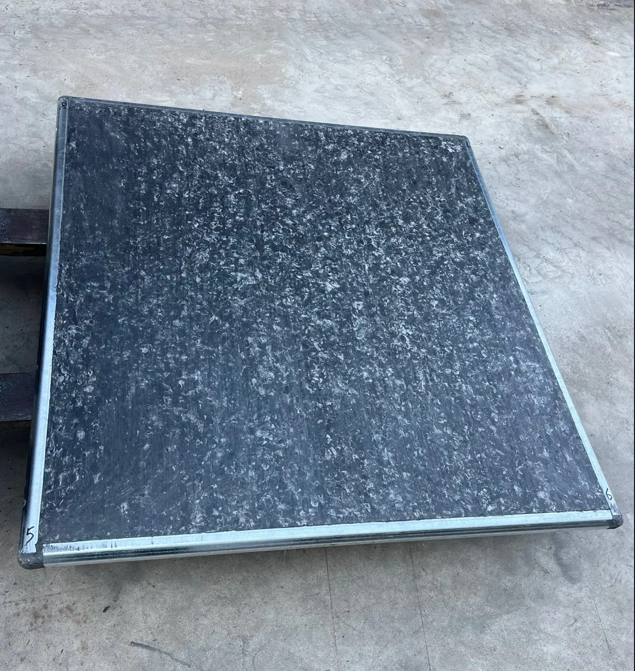
What Break-Even Analysis Actually Reveals
Break-even analysis identifies the exact month your cumulative savings from GMT pallets equal the additional capital invested upfront. It is not a payback period calculation weighted by time value of money, and it is not an ROI percentage. It answers one question: how many production months until the extra $70-90 per pallet invested in GMT returns through lower replacement purchases, reduced maintenance labor, and fewer brick material losses.
The calculation treats the pallet fleet as operating infrastructure with measurable cost per cycle, not as a commodity purchase. Wood pallets appear cheaper because their 30-38% annual replacement rate spreads across multiple purchase orders throughout the year. GMT pallets front-load the investment but distribute it across 10-12 years of service life, the variable that shifts break-even timelines from “impossible” to “first year” once you account for total fleet lifecycle cost.
Production volume amplifies savings velocity — higher throughput multiplies breakage reduction across more units, accelerating payback from 18+ months in low-volume operations to under 12 months in high-volume facilities.
The Three Hidden Costs Wood Pallets Carry
Wood pallet economics hide three recurring cost categories that never appear on the purchase order but compound across the pallet’s working life.
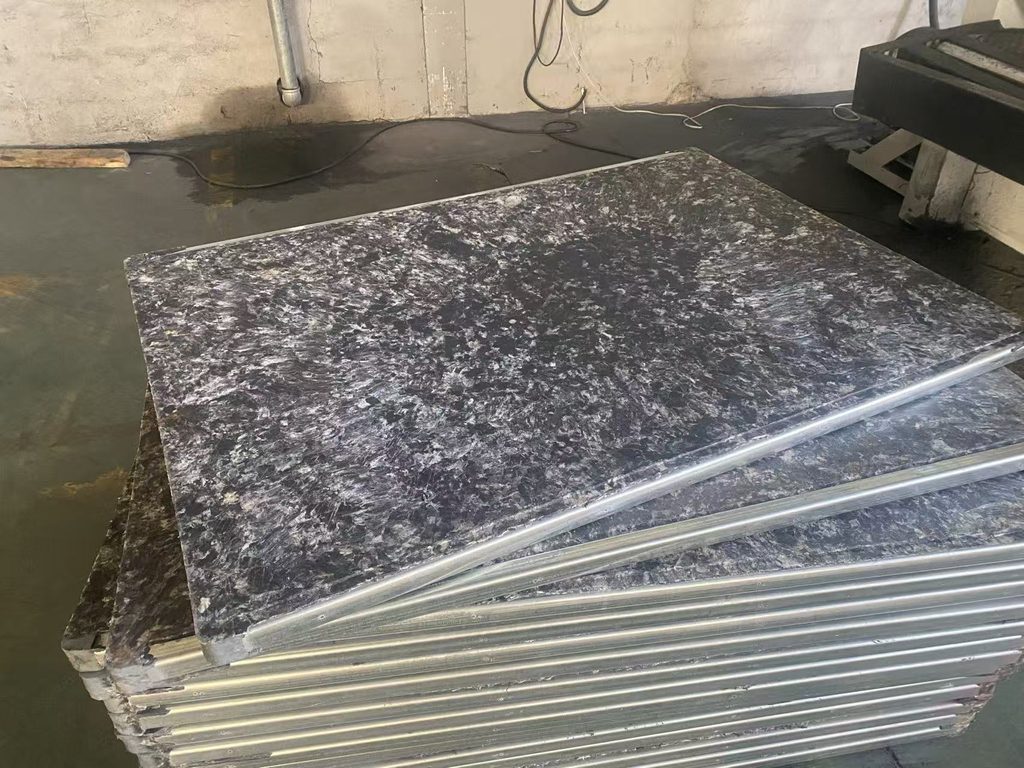
Replacement frequency is the largest gap. Wood pallets for brick production last 2-3 years versus GMT’s 10-12 years. A 200-pallet fleet replaces 60-76 wood units annually (30-38% rate) versus 16-20 GMT units (8-10% rate), a $1,500-2,800 annual cost difference.
Maintenance labor: Wood warping requires 12-20 hours monthly per 200 pallets for inspection and surface planing, versus 2-3 hours for GMT. At $26/hour, that’s $3,100-5,300 annual savings.
Brick breakage from pallet defects is typically the largest cost. Wood’s uneven surfaces cause 8-12% breakage versus GMT’s 2-4%. On 200,000 bricks monthly at $0.65 material cost, that 6-8 point reduction saves $93,600-124,800 annually.
| Cost Category | Wood Pallet (Annual) | GMT Pallet (Annual) | Annual Savings |
|---|---|---|---|
| Replacement purchases (200-pallet fleet) | $2,100-2,660 | $1,680-2,100 | $420-560 |
| Maintenance labor (inspection, repair) | $3,744-6,240 | $624-936 | $3,120-5,304 |
| Breakage material loss (200k bricks/mo) | $124,800-156,000 | $31,200-41,600 | $93,600-114,400 |
| Total annual operating cost | $130,644-164,900 | $33,504-44,636 | $97,140-119,304 |
These three cost categories together create the annual benefit side of the break-even equation. The math shifts decisively toward GMT when you account for the full cost structure, not just the purchase price.
Building the Break-Even Timeline
Step 1 — Additional investment: Fleet size × (GMT unit price − Wood unit price)
Example: 200 pallets × ($105 − $35) = $14,000
Step 2 — Annual savings: (Wood replacement cost − GMT replacement cost) + (Wood maintenance cost − GMT maintenance cost) + (Wood breakage loss − GMT breakage loss)
Pull replacement rates from purchase records, track maintenance hours for one month, calculate breakage as (breakage % × monthly production × brick material cost × 12).
Step 3 — Break-even timeline: Additional investment ÷ (Annual savings ÷ 12)
Worked Calculation: 200-Pallet Semi-Automated Facility
Here is the formula applied to a mid-size operation running 200 active pallets with monthly production of 240,000 standard bricks on a semi-automated line in a moderate climate.
Facility profile:
- Active pallet fleet: 200 units
- Monthly production: 240,000 standard bricks
- Brick material cost: $0.62 per unit
- Labor rate: $26/hour
- Climate: moderate humidity
Step 1 — Additional investment
200 pallets × ($105 GMT − $35 wood) = $14,000 additional capital
Step 2 — Annual savings breakdown
Replacement cost savings:
- Wood: 200 × 34% annual replacement × $35 = $2,380
- GMT: 200 × 9% annual replacement × $105 = $1,890
- Replacement savings: $2,380 − $1,890 = $490
Maintenance labor savings:
- Wood: 16 hrs/month × 12 × $26/hr = $4,992
- GMT: 2.5 hrs/month × 12 × $26/hr = $780
- Maintenance savings: $4,992 − $780 = $4,212
Breakage reduction savings:
- Wood loss: 240,000 bricks/mo × 10.5% × $0.62 × 12 = $186,624
- GMT loss: 240,000 bricks/mo × 3% × $0.62 × 12 = $53,568
- Breakage savings: $186,624 − $53,568 = $133,056
Total annual savings: $490 + $4,212 + $133,056 = $137,758
Step 3 — Break-even timeline
Monthly savings: $137,758 ÷ 12 = $11,480
Break-even point: $14,000 ÷ $11,480 = 1.22 months (approximately 5-6 weeks)
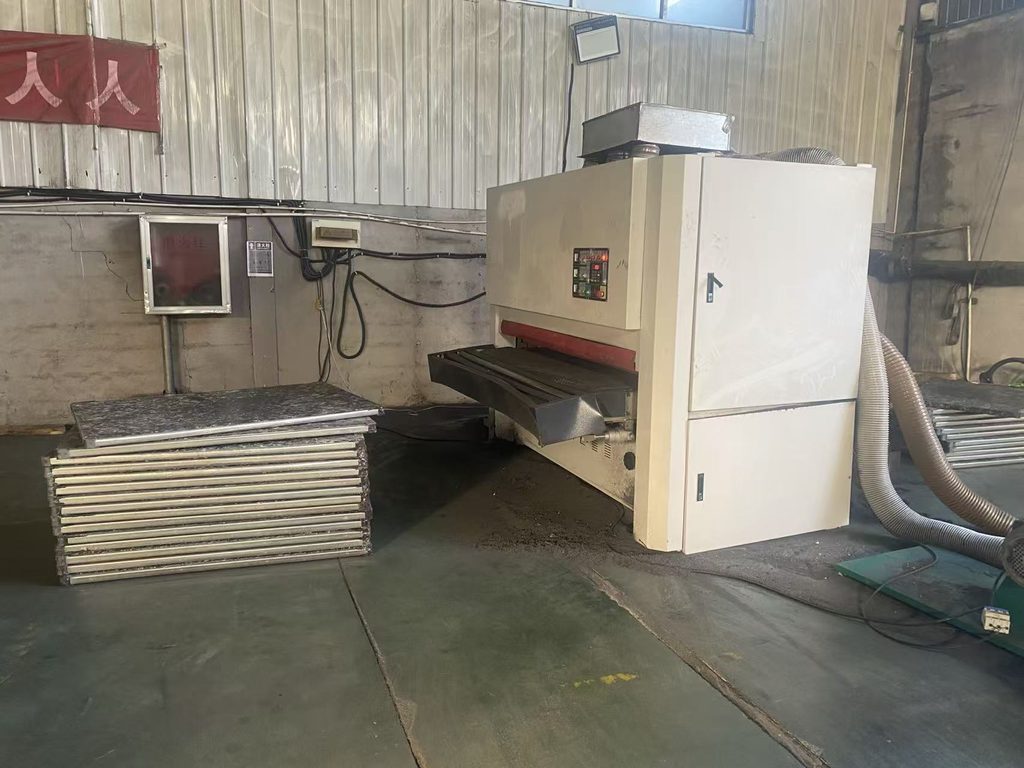
This facility recovers its GMT investment inside the second production month. The dominant factor is breakage reduction at 96.6% of total savings. That is the consistent pattern in moderate-to-high volume facilities: breakage savings dwarf replacement and maintenance savings once monthly production crosses 150,000-200,000 units. Lower-volume operations see longer but still favorable timelines driven more by maintenance and replacement savings.
| Production Month | Wood Cumulative Cost | GMT Cumulative Cost | Savings Accumulated | Break-Even Status |
|---|---|---|---|---|
| Month 0 | $7,000 (initial) | $21,000 (initial) | −$14,000 | Not yet |
| Month 1 | $17,887 | $23,793 | −$5,906 | Not yet |
| Month 2 | $28,774 | $26,586 | +$2,188 | Break-even achieved |
| Month 6 | $72,322 | $38,965 | +$33,357 | Savings accelerating |
| Month 12 | $137,644 | $54,504 | +$83,140 | Full annual benefit |
After break-even, every production month adds $11,480 in net savings that compounds across the GMT pallet’s 10-12 year service life. The facility above generates $550,000-650,000 in cumulative savings over the pallet fleet’s working life compared to continuous wood pallet replacement.
Break-Even Timeline by Production Volume
Monthly production volume is the single largest variable that moves break-even timelines. Higher throughput multiplies the per-brick breakage savings across more units, accelerating payback. The table below segments break-even windows by volume tier and line automation level.
| Monthly Production | Line Type | Wood Breakage Rate | GMT Breakage Rate | Break-Even Timeline |
|---|---|---|---|---|
| 50,000-100,000 bricks | Manual or semi-automated | 9-11% | 3-4% | 18-24 months |
| 100,000-200,000 bricks | Semi-automated | 10-12% | 2.5-3.5% | 12-18 months |
| 200,000-300,000 bricks | Automated | 11-13% | 2-3% | 8-12 months |
| 300,000+ bricks | Fully automated high-speed | 12-14% | 2-3% | 6-10 months |
Low-volume operations see extended timelines because absolute savings are smaller: a 75,000 brick/month line saves $28,000 annually from 8% breakage reduction, while a 350,000 brick/month line saves $131,000 from the same percentage improvement.
Automated lines see faster payback because dimensional consistency directly affects throughput. Automated brick making operations report 12-15% higher capacity on GMT versus wood by eliminating handling delays from warped pallets.
Climate Impact on Payback Speed
Humidity accelerates wood degradation, compressing service life from 3 years to under 2 years and pushing replacement rates from 30-35% to 40-50%. This shortens GMT break-even by 3-5 months versus dry climates.
| Climate Zone | Wood Replacement Rate | Wood Breakage Rate | Break-Even Timeline | Notes |
|---|---|---|---|---|
| Arid (low humidity) | 28-32% | 9-10% | 14-16 months | Wood degradation slower |
| Moderate | 32-36% | 10-11% | 10-12 months | Standard conditions |
| Humid tropical | 38-45% | 12-14% | 8-10 months | Wood warping accelerates |
| Extreme humid | 45-52% | 13-15% | 6-8 months | Wood service life <2 years |
Humidity-resistant GMT pallets maintain <1% moisture absorption versus wood’s 15-25% in high-humidity zones. Facilities in Southeast Asia and tropical regions report 6-10 month break-even due to accelerated wood degradation.
When Wood Pallets Still Make Financial Sense
Very low volume (under 50,000 bricks monthly): Annual savings of $15,000-18,000 on a $10,500 GMT investment means 18-30 month break-even. Capital-constrained operations may prefer wood’s lower upfront cost.
Temporary setups (under 3 years): A 14-month break-even leaves limited time to accumulate savings before shutdown.
Existing wood inventory: If functional wood pallets have 1-2 years remaining life, phased GMT adoption as wood fails delivers better outcomes than immediate fleet-wide replacement.
Mistakes That Extend Your Break-Even Point
Ignoring maintenance labor: Wood inspection and repair consume 10-18 hours monthly per 200 pallets, costing $3,600-8,640 annually at loaded labor rates.
Using list prices instead of delivered cost: GMT quoted at $95 FOB may cost $110-120 delivered; wood quoted at $28 may cost $35-38. Use actual delivered prices.
Calculating breakage on sale price instead of material cost: Use material cost ($0.62) not sale price ($1.85) to avoid inflating savings 3x.
Ignoring climate: Arid regions overstate GMT advantage using average replacement rates; humid regions underestimate wood degradation, adding 4-6 months to calculated break-even.
FAQ
How do I calculate break-even for a mixed fleet?
Calculate investment only for upgraded pallets. If replacing 100 wood with GMT while keeping 200 wood, investment is 100 × price difference. Calculate savings based on GMT’s share of production cycles.
What if my facility produces multiple brick sizes?
Use weighted average cost. For 150,000 standard bricks at $0.60 and 50,000 premium at $0.90: (150k×$0.60 + 50k×$0.90) ÷ 200k = $0.68 per brick.
How does GMT pallet thickness affect break-even?
Thicker pallets (20-25mm) cost $10-18 more but extend service life to 12-15 years, reducing replacement rate from 9-10% to 7-8%. Heavy-duty GMT pallets suit high-volume lines planning 15+ year operation.
What breakage reduction should I use without tracked data?
Use conservative 5-6 percentage point reduction (e.g., 11% wood to 5-6% GMT) instead of the 7-9 point reductions in optimized facilities. Track actual breakage for 60-90 days post-installation and refine calculations.
Conclusion
GMT pallet break-even analysis reveals what price comparison hides: the additional $70-90 per pallet invested upfront is recovered within 8-14 months through lower replacement purchases, reduced maintenance labor, and fewer brick material losses. Facilities producing over 200,000 bricks monthly see break-even in the first year.
Rhinos Pallet manufactures fiber-reinforced GMT pallets with 10-12 year service life, moisture resistance below 1%, and dimensional tolerance suitable for automated handling. Contact us for facility-specific break-even calculation support and delivered pricing for your fleet size.